UK : 63, St Mary Axe, London, United Kingdom, EC3A 8AA
AU : Suite 202, 234 George Street, Sydney, New South Wales, Australia. 2000
Email Us Mon-Fri, 10:00 AM to 6:00 PMGreen Economy: Investing in a Sustainable Future

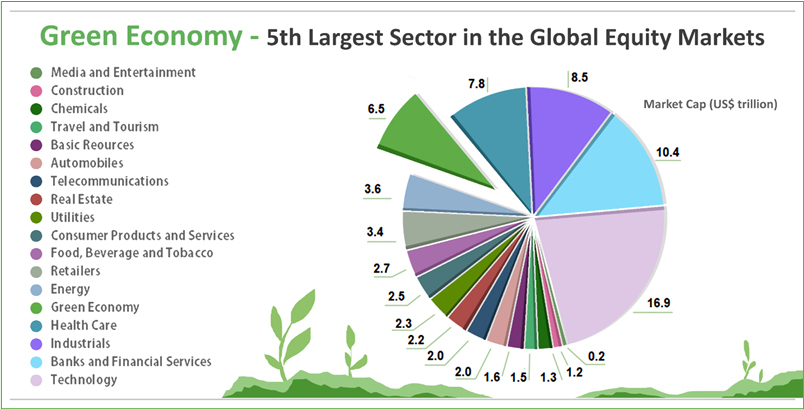
With a capitalization of USD 6.5 trillion, the green economy on a standalone basis is the 5th largest sector, surpassing energy, consumer, automobiles, and real estate sectors. In 2023, clean electricity constituted about 80% of the new global capacity, while electric vehicles made up one in five cars sold as per International Energy Association (IEA). These trends reflect significant progress toward sustainability and reducing carbon emissions worldwide
Data Source: FTSE Russell; Image Source: © 2024 Krish Capital Pty.Ltd; Analysis: Haanuwise
The S&P 500 Carbon Efficient Index (CEI) tracks the performance of S&P 500 companies by adjusting weights based on their carbon emissions per revenue unit. This approach integrates low-carbon factors into market indices, reducing overall carbon exposure while preserving industry balance. The annualized return for the index from October 2023 to October 2024 is about 34.48% as on 24th October 2024, versus surpassing Dow Jones Industrial Average annualized return of 28.27%.
.png)
The index Launch Date is Oct 22, 2018. All information for an index prior to its Launch Date is hypothetical back-tested, not actual performance, based on the index methodology in effect on the Launch Date
Source: SP Global, Analysis: Haanuwise
As the green economy grows and broadens its scope, it is increasingly driving economic growth, job creation, and energy supply. Moreover, it has become a pivotal geopolitical consideration. Governments are increasingly acknowledging their role in catering to climate change and environmental challenges, seeing it as a first step towards future energy security and thereby lowering dependency on conventional fossil fuels.
Data Source: FTSE Russell; Image Source: © 2024 Krish Capital Pty. Ltd; Analysis: Haanuwise
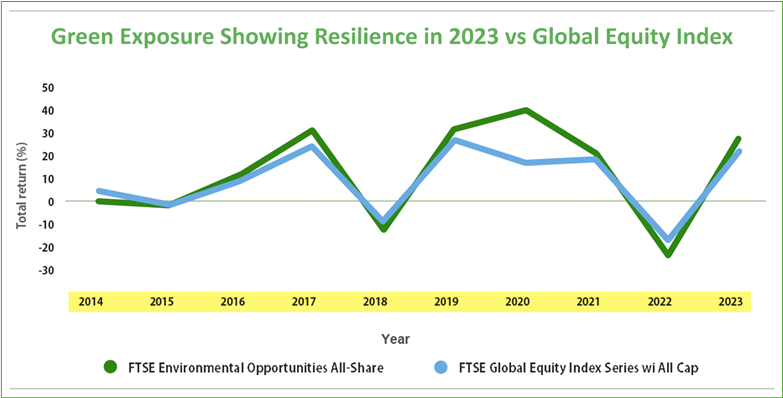
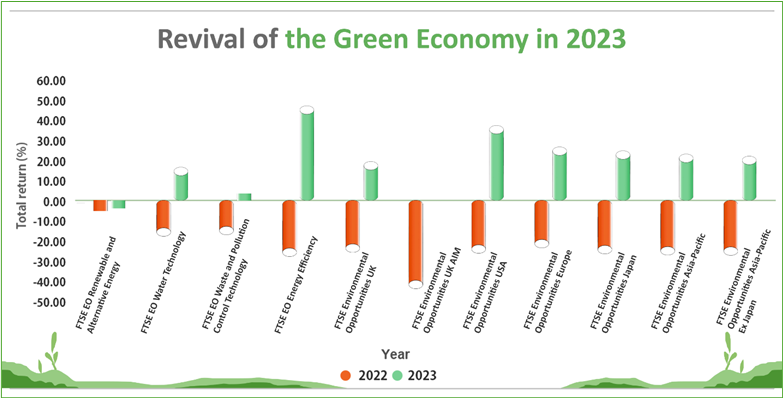
The valuation premium of green equities in the post-pandemic period has exacerbated the underperformance of green economy in 2022. Besides, the green economy plummeted in 2022 due to several factors such as rising geopolitical tensions, rapid interest rate hikes, and increasing inflationary pressures. However, the valuation of green companies has demonstrated resilience in 2023, aided by market capitalization recouping to its 2021 average. Against a backdrop of high interest rate environment in 2023, FTSE Environmental Opportunities All-Share Index started outperforming the broad global market index, proxied by FTSE Global Equity Index. By the end of Q2 2023, the valuation premium on green companies have reduced from the premiums in 2020-21.
Data Source: FTSE Russell; Image Source: © 2024 Krish Capital Pty.Ltd; Analysis: Haanuwise
The green revenues constitute 7.2% of the total revenues as of December 2022 at a 10-year average growth rate of 6.6%. This green revenue growth exceeds the broader listed equity market growth rate of 5.1%. Regardless of volatility in the financial market, the green economy is gradually expanding when policy makers emphasize the strategic importance of green economy fostering economic growth and ensuring energy security. The government has been bolstering clean energy development with the adoption of the EU Net-Zero Industry Act and US Inflation Reduction Act.
As green companies are moving towards maturity, they are becoming larger in size and thereby supporting their viability across investment opportunities. The green companies with 100% green revenues have recorded an average market capitalization of around USD 7 billion by June 2023, which is 6 times greater than the figures of 2016. This showcase increasing focus on green economy among the investors to ensure energy security and tackle climate crisis.
Data Source: FTSE Russell; Image Source: © 2024 Krish Capital Pty.Ltd; Analysis: Haanuwise
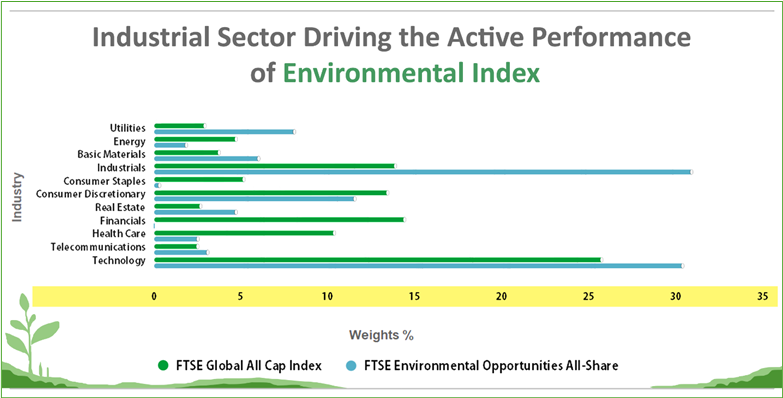
The above chart depicts that environmental index as measured by FTSE Environmental Opportunities All-Share, composes largest active weights in Industrial sector against a broad equity market of FTSE Global All Cap Index. This reveals that outperformance of environmental index relative to broad equity market being driven by industrial sector with active weights of 17.06%, followed by utilities sector with active weights of 5.17%.
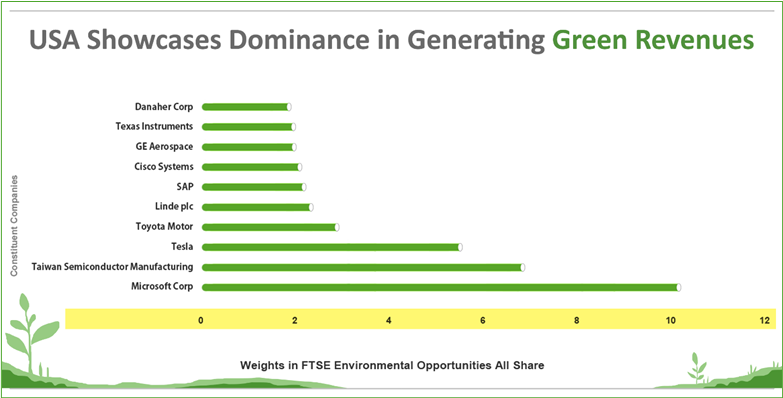
Data Source: FTSE Russell; Image Source: © 2024 Krish Capital Pty.Ltd; Analysis: Haanuwise
USA leads the attribution of green revenues in their overall revenue base led by Microsoft Corp weighing 10.20% in the FTSE Environmental Opportunities All Share Index, followed by Tesla’s weight exposure of 5.55% for the same. Thereafter, Japan and Germany are found to be prime constituents of FTSE Environmental Opportunities All Share Index.
Outlook
Under the guidance of industrial policy in the 21st century, the green economy gradually becoming prominent driver in supporting export industries such as semiconductors and automobiles. The green technologies and the competitive advantage of export industries underlines as the industrial backbone in the US, China, Germany, and Japan. The International Energy Agency (IEA) projects that renewable capacity will supply 35% of global power generation by 2025, marking a significant step towards a more sustainable and low-carbon energy future.
Disclaimer – The information available on this website is provided for education and informational purposes only. It does not constitute or provide financial, investment or trading advice and should not be construed as an endorsement of any specific stock or financial strategy in any form or manner. We do not make any representations or warranties regarding the quality, reliability, or accuracy of the information provided. This website may contain links to third-party content. We are not responsible for the content or accuracy of these external sources and do not endorse or verify the information provided by third parties. We are not liable for any decisions made or actions taken based on the information provided on this website.


