


UK : 63, St Mary Axe, London, United Kingdom, EC3A 8AA
AU : Suite 202, 234 George Street, Sydney, New South Wales, Australia. 2000
Email Us Mon-Fri, 10:00 AM to 6:00 PMCharting Growth: Strategies for Thriving in the US Markets in 2024

Growth prospects among the US investors are observed to be rising in 2023, as evident by their active spending in the high-interest rate environment. American consumers were found to be heavily investing in growth-oriented stocks, as evident by the 1-year growth rate till 6th May 2024, at 42.18%% and 26.89% in the S&P 500 Technology index and S&P 500 consumer discretionary index, respectively.
For the year 2024, investors might ponder their risk tolerance to cater to their investment needs. If the US can steer clear of recession, cyclical sectors like industrials, consumer discretionary, technology, and industrials are likely to perform over a prolonged period. In contrast, to mitigate economic downside performance, defensive sectors like healthcare and consumer staples may upgrade.
The Fed began to increase interest rates to tackle high inflation from 2022 onwards till it was paused in July 2023. As of March 2024, the Fed has been reluctant to slash interest rates and left them unchanged at 5.25% - 5.50%. However, the Fed has reflected to adopt three rate cuts in 2024, thereby uplifting consumer spending over the same period.
Given this backdrop, some of the growth-oriented sectors in 2024 as identified includes: Energy, Precious Metals, Materials, Financial, and Artificial Intelligence & Emerging Technologies. Further, the data analysis involves categorizing companies according to their market capitalization within their specific sectors.
 ENERGY
Data source: MSCI; Image Source: © 2024 Krish Capital Pty.Ltd
Key Trends:
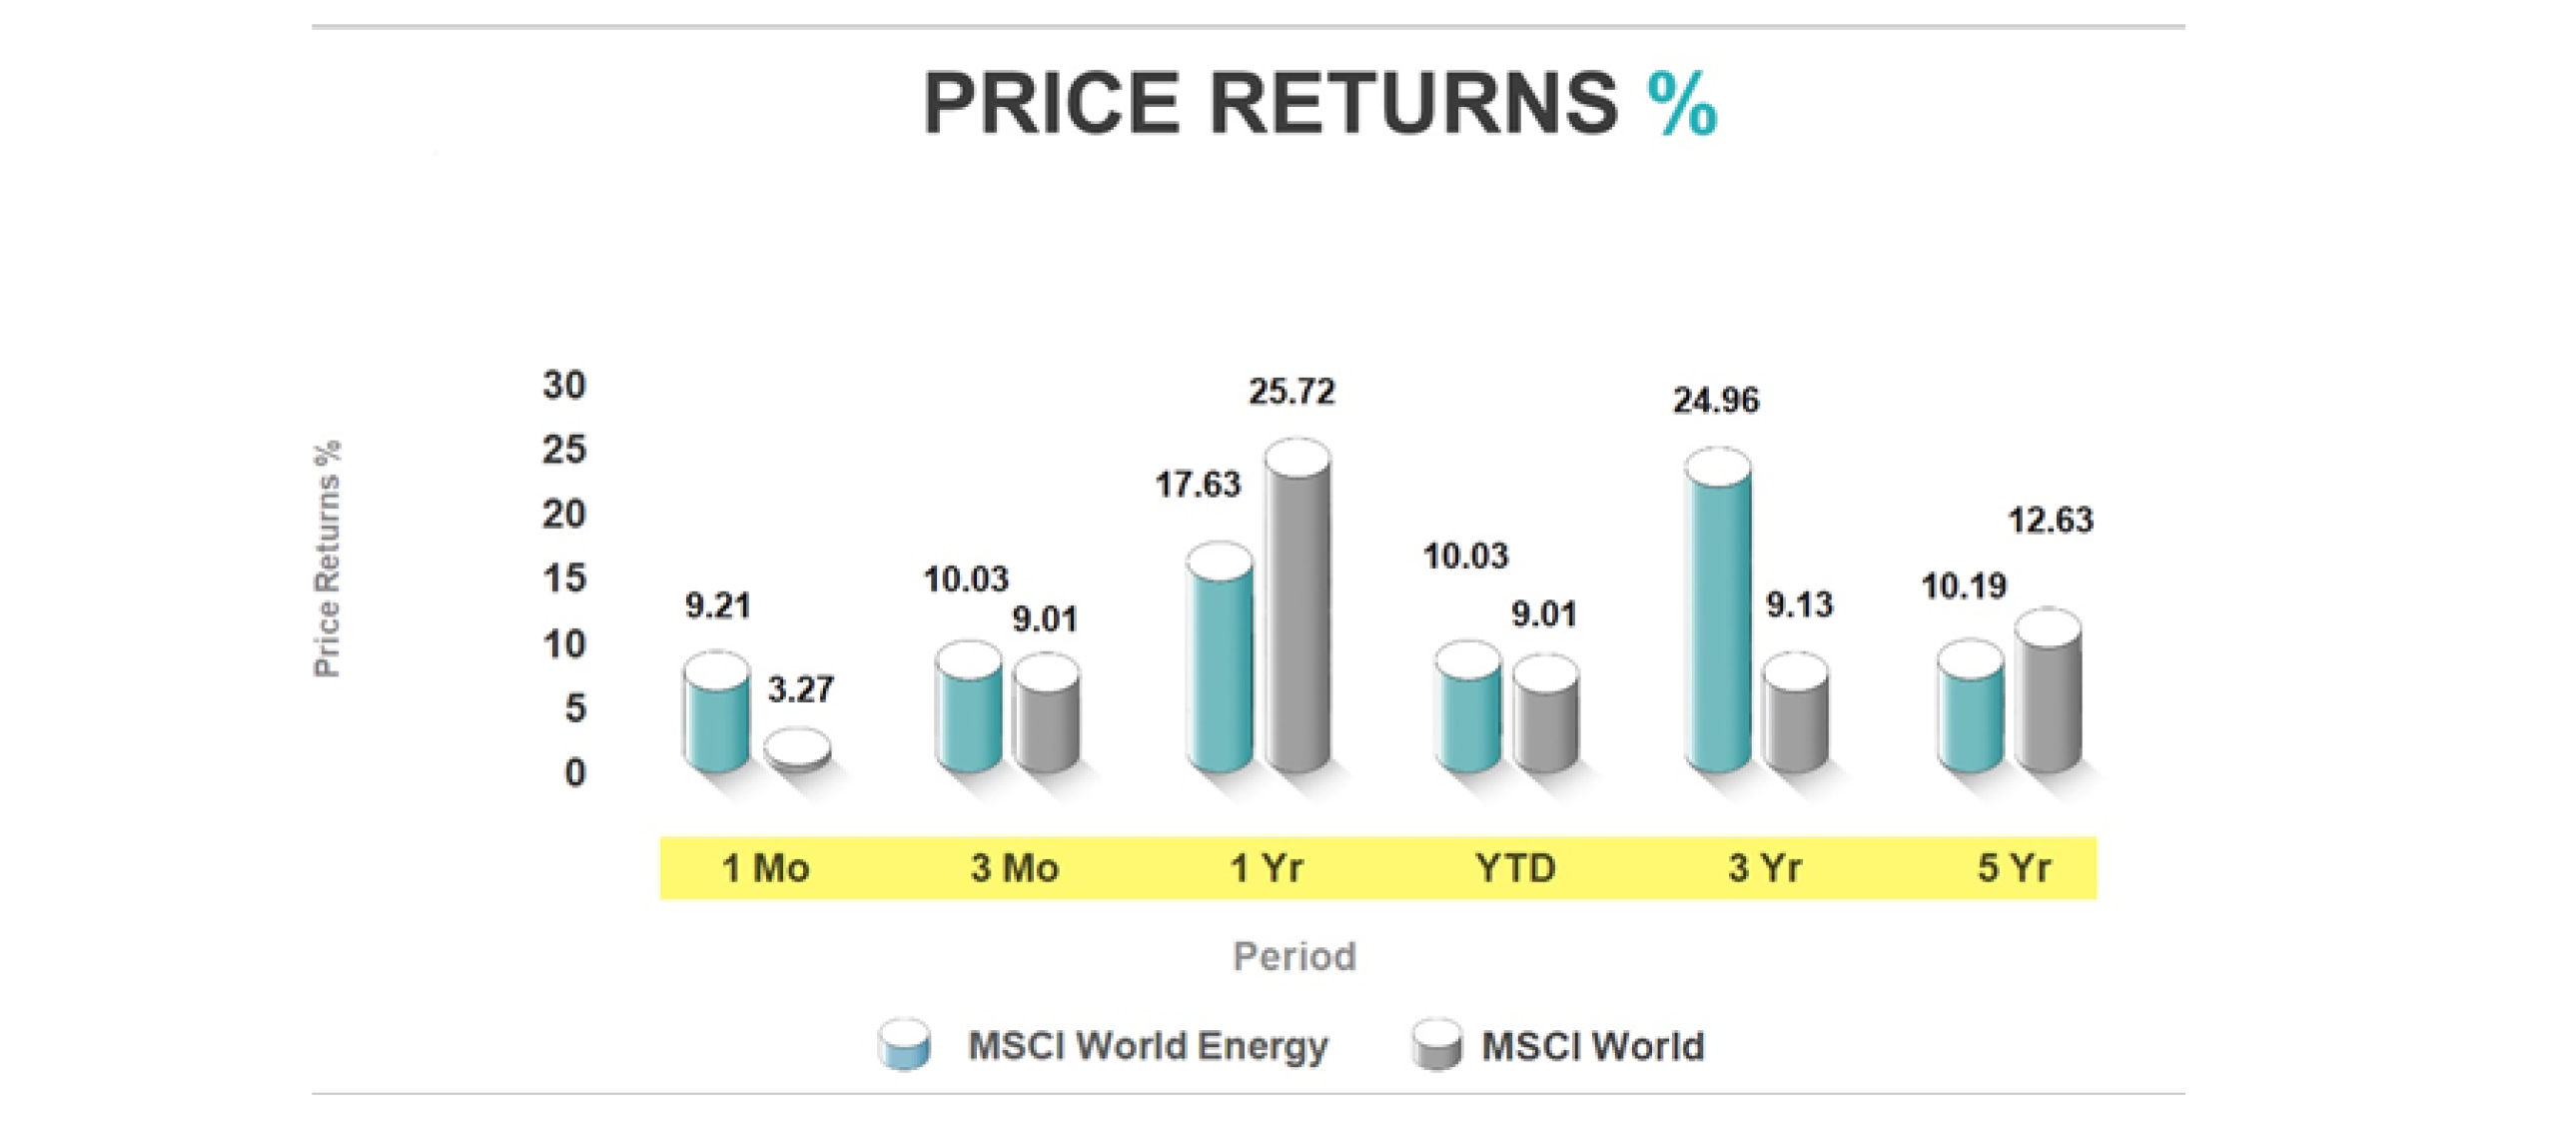
Data source: MSCI; Image Source: © 2024 Krish Capital Pty.Ltd Recent Performance: The World Energy Sector outperformed the benchmark index (MSCI World Index) in the recent period, represented by 1-month and 3-months’ performance partially driven by the renewable energy sector.
Historical Trend: Over the past 5 years, the energy sector fell moderately below the benchmark index as energy demand increased amid economic slowdown increasing pressure on commodity prices. The energy sector outperformed the MSCI World Index over a 3-year period, owing to surging energy prices and supply chain disruptions.
Geopolitical Tensions: Oil and gas producers attained profit during elevated geopolitical risk, rising demand, and constrained supply channels over the past 2-3 years.
Growth in Renewable Energy Sector: Energy-efficient movements have multiplied with increasing renewable capacity in the US. Notably, 80% of the new power generation capacity is estimated to be contributed by renewable capacity. Currently, the renewables’ share in the global electricity mix amounts to be around 50%, attributed to increased solar PV generating capacity against the entire US power system.
Source: Refinitiv; Image Source: © 2024 Krish Capital Pty.Ltd; Analysis: Haanuwise
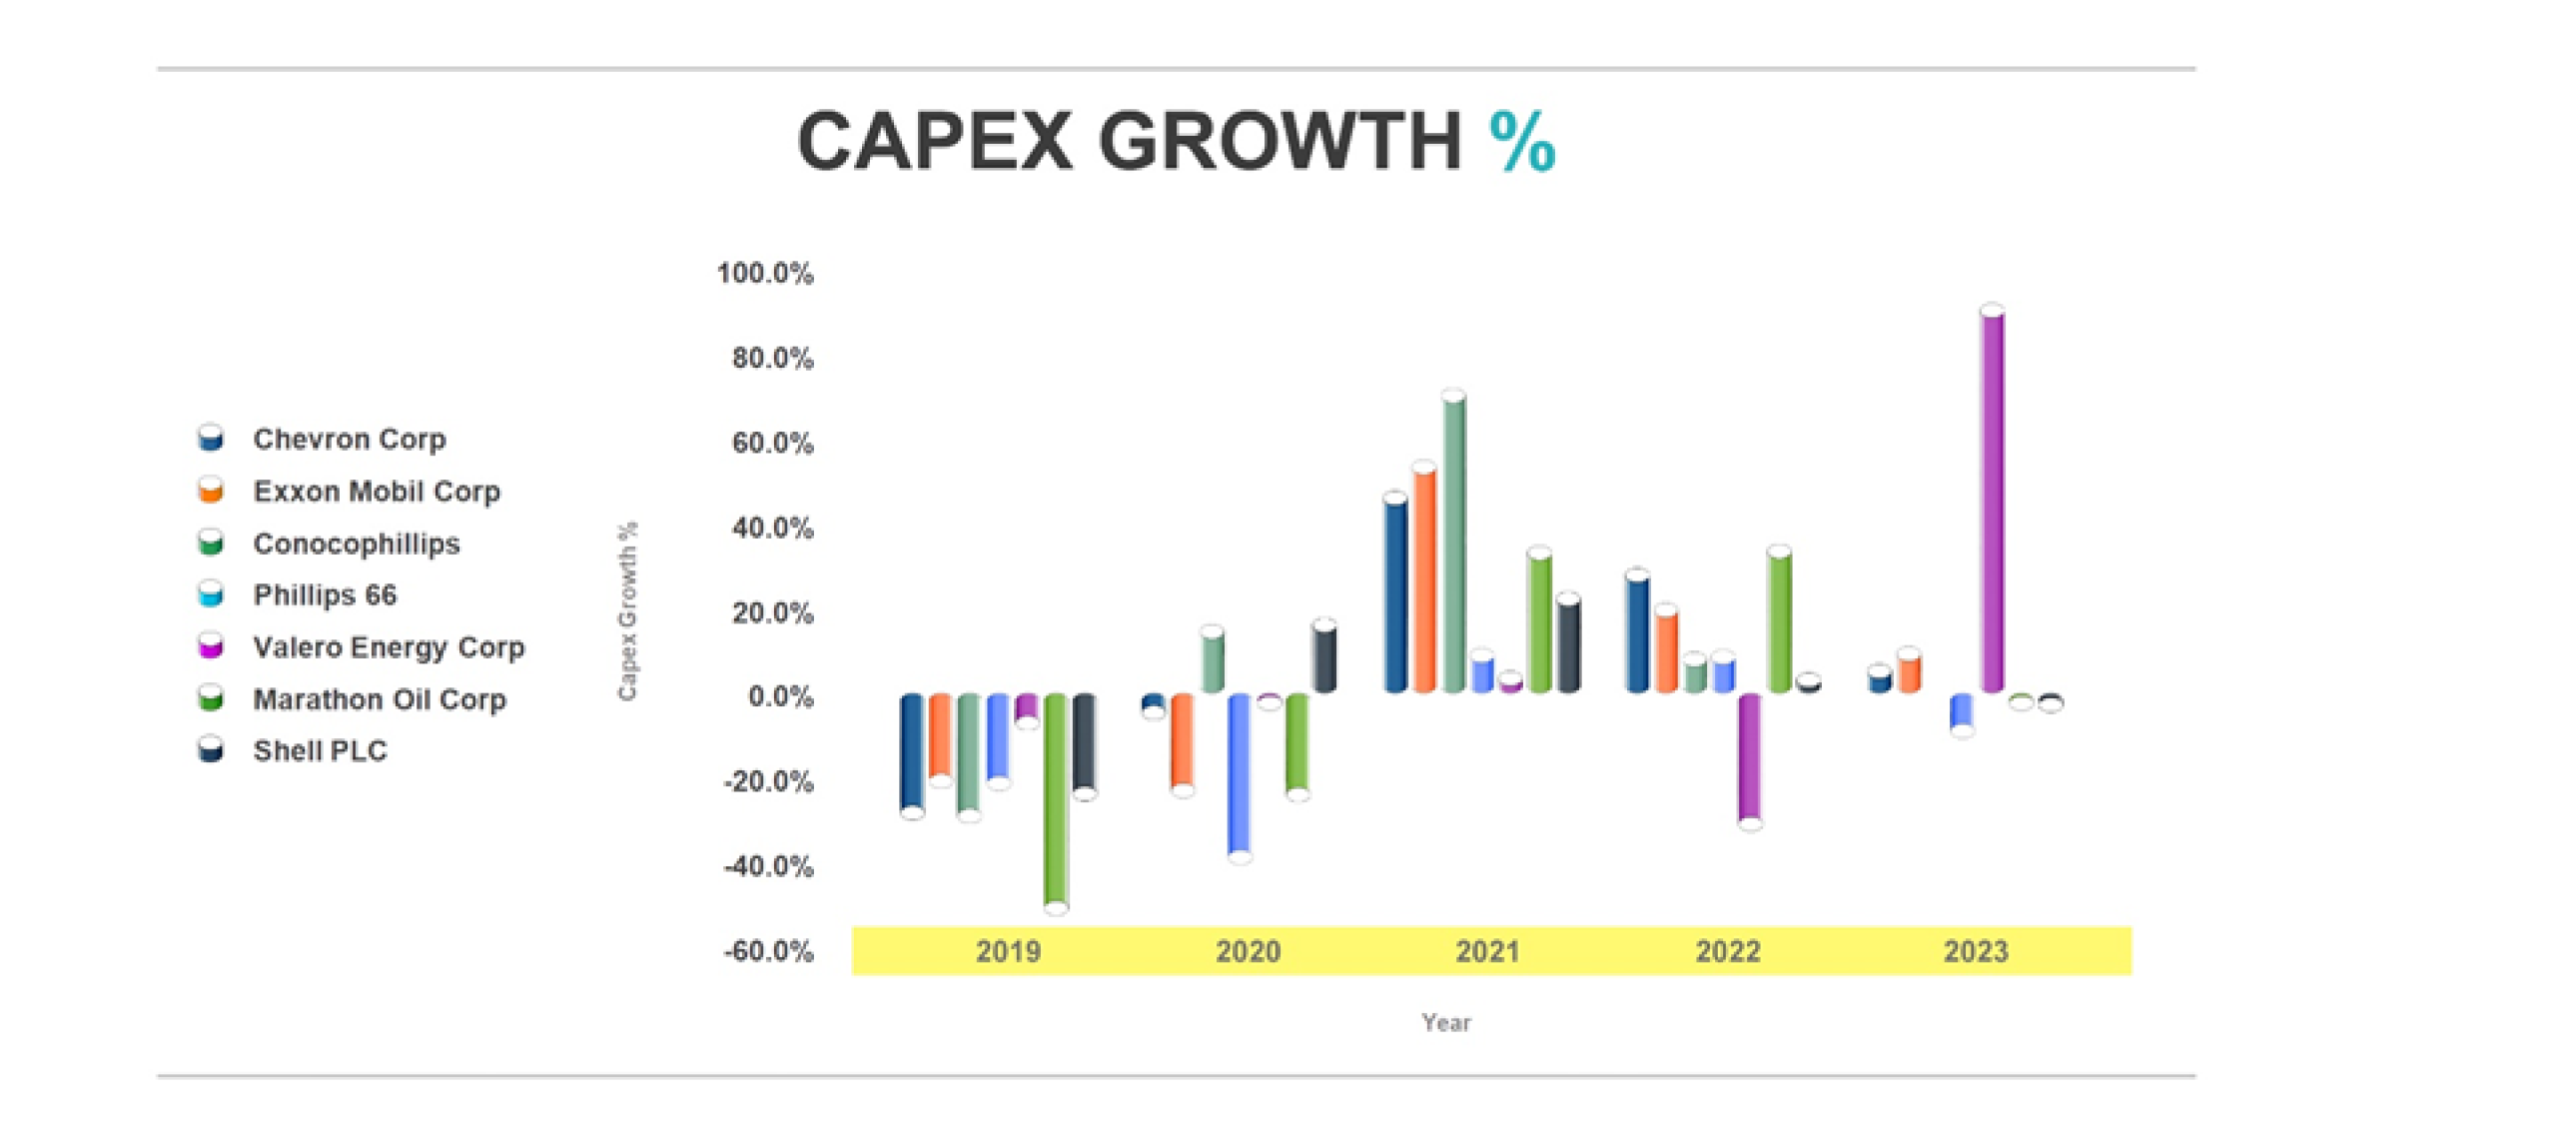
Capital Investments: Energy sector majorly depends upon the infrastructure which includes heavy installations in renewable energies, power plants and refineries. The growth in capex for energy companies indicates the targeted expansion aiming upgrading efficiency and production capacity.
Stock Insights: Valero Energy Corp uplifted its capex in 2023 by 91.7% as compared to its negative growth of 32.6% in 2022. Chevron Corp, Exxon Mobil Corp, and Conocophillips demonstrated a series of growth in its capex over a period from 2020 to 2023.
Data source: Refinitiv; Image Source: © 2024 Krish Capital Pty.Ltd; Analysis: Haanuwise
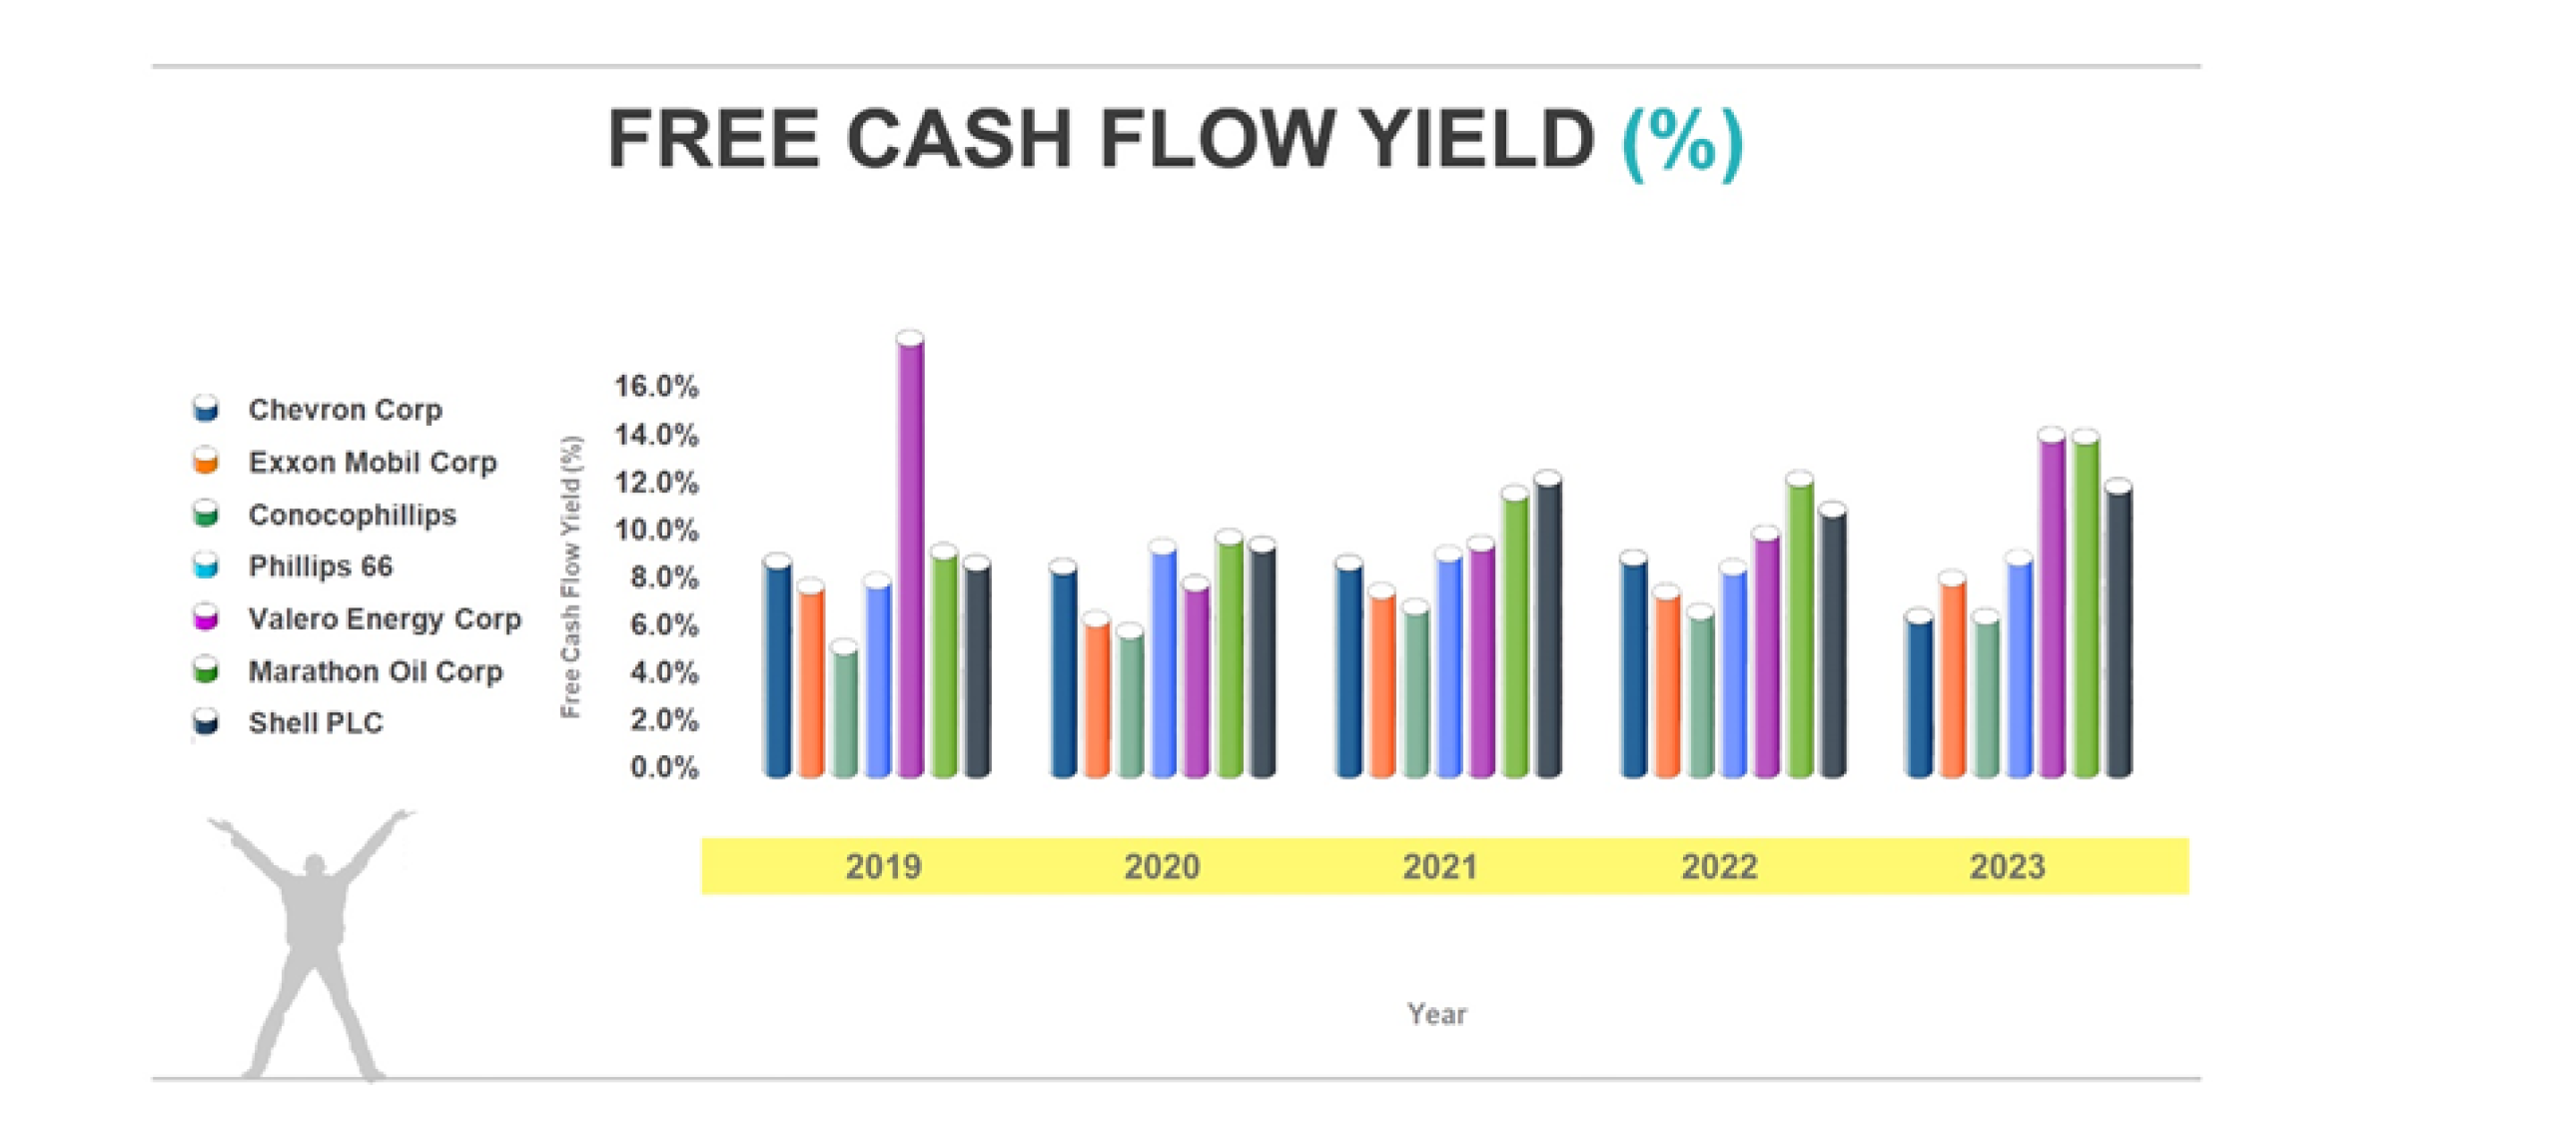
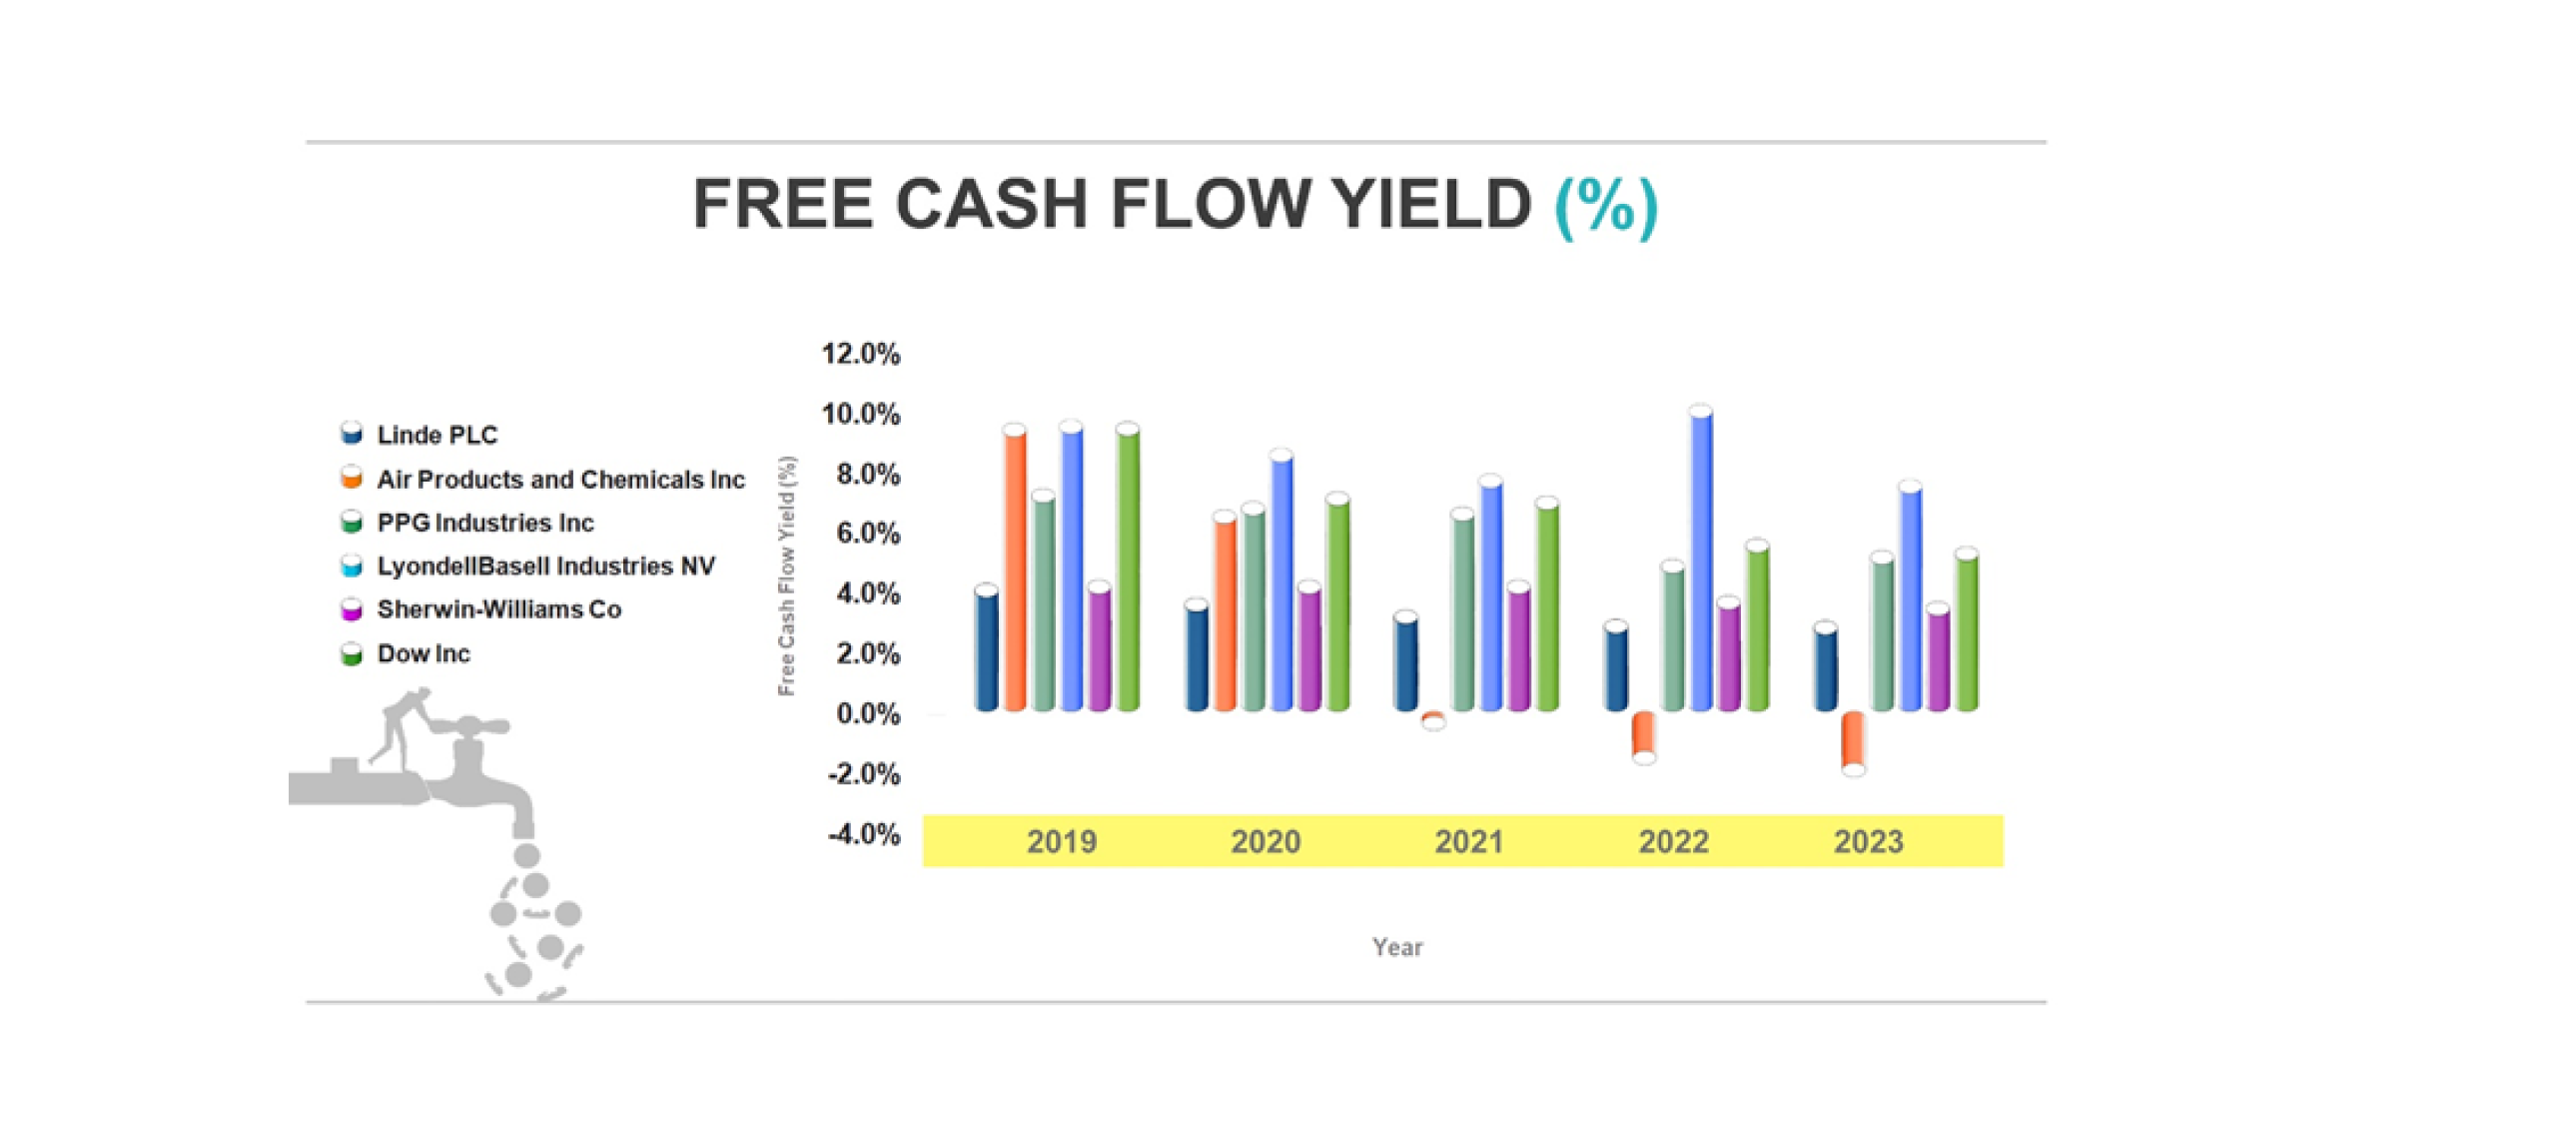
*Free cash flow yield = Free cash flow (FCF) / Market cap
Cash Generation: Free cash flow yield is another metric that enables the investor to analyze cash generation by the companies relative to their asset base. Moreover, free cash flow is ascertained after accounting for capex helmed by the energy company.
Stock Insights: Among the companies analyzed, Valero Energy Corp and Marathon Oil Corp generated higher free cash flow yield than peer firms, with the figures 14.8% and 14.7%, respectively in the year 2023.
 PRECIOUS METALS
Data source: MSCI; Image Source: © 2024 Krish Capital Pty.Ltd
Key Trends:
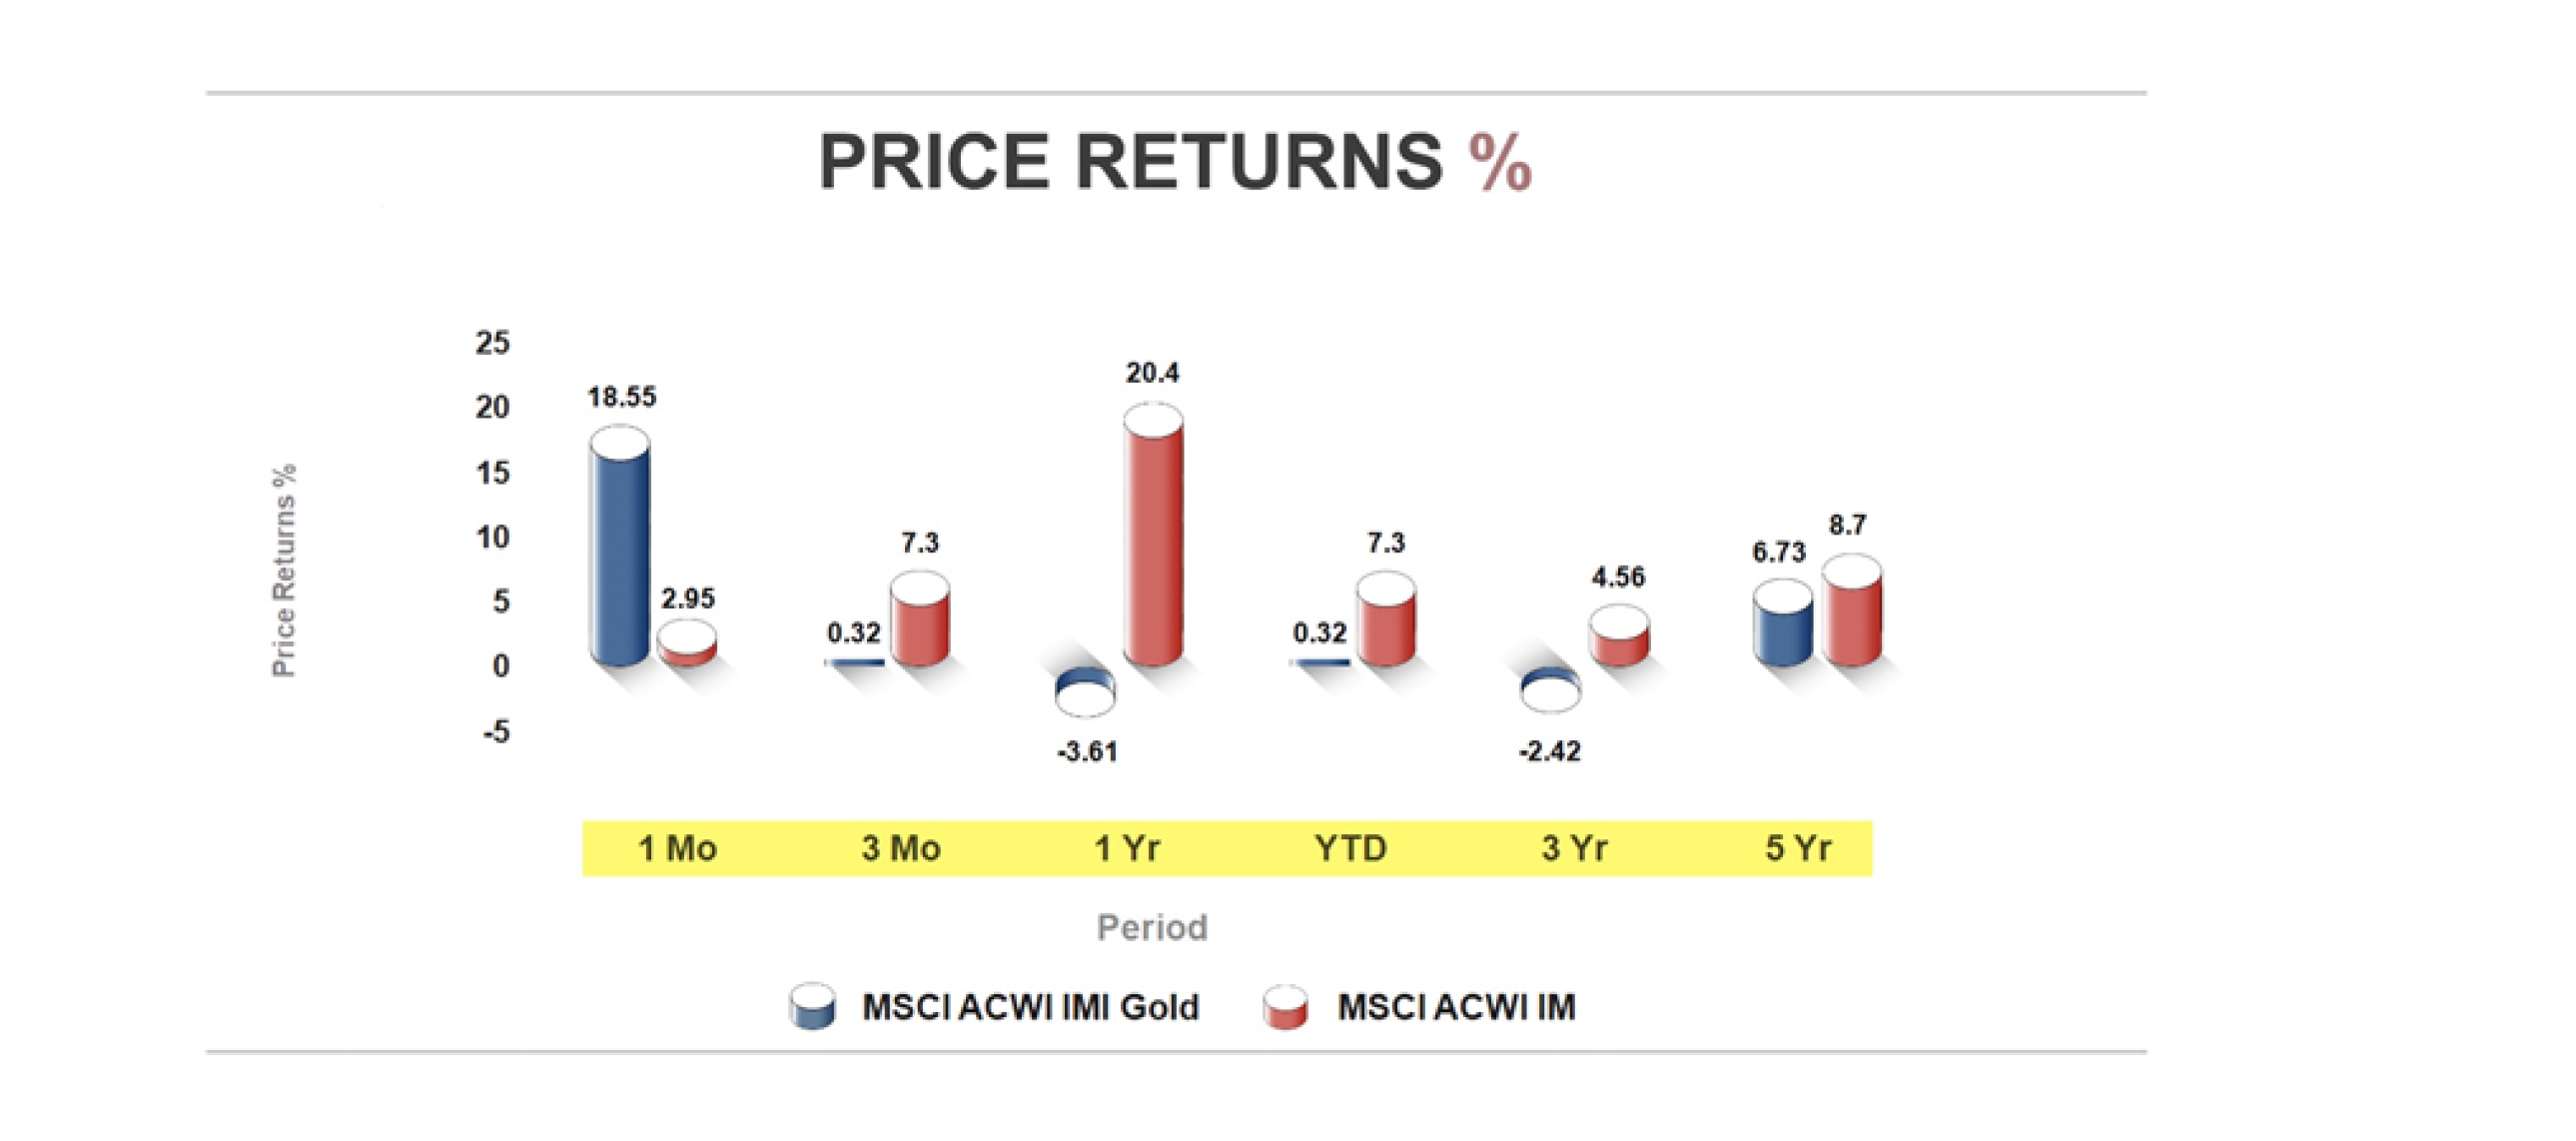
Index Performance: Precious Metals outperformed the benchmark index over the 1-month performance relative to long-term performance at a global level.
Price escalation: Precious metals’ price escalated due to rising geopolitical concerns and uncertainties related to global economic stability. As a result, the investors found safe haven in gold, pushing gold prices to peak in January 2023. Later in 2023, the gold performance plunged moderately due to sluggish demand in China, interest rate hikes by Fed, and appreciating dollar value. The outlook for gold companies looks strong in 2024 with surging volumes amid Fed rate cuts and weakening of US dollar.
Data source: Refinitiv; Image Source: © 2024 Krish Capital Pty.Ltd; Analysis: Haanuwise
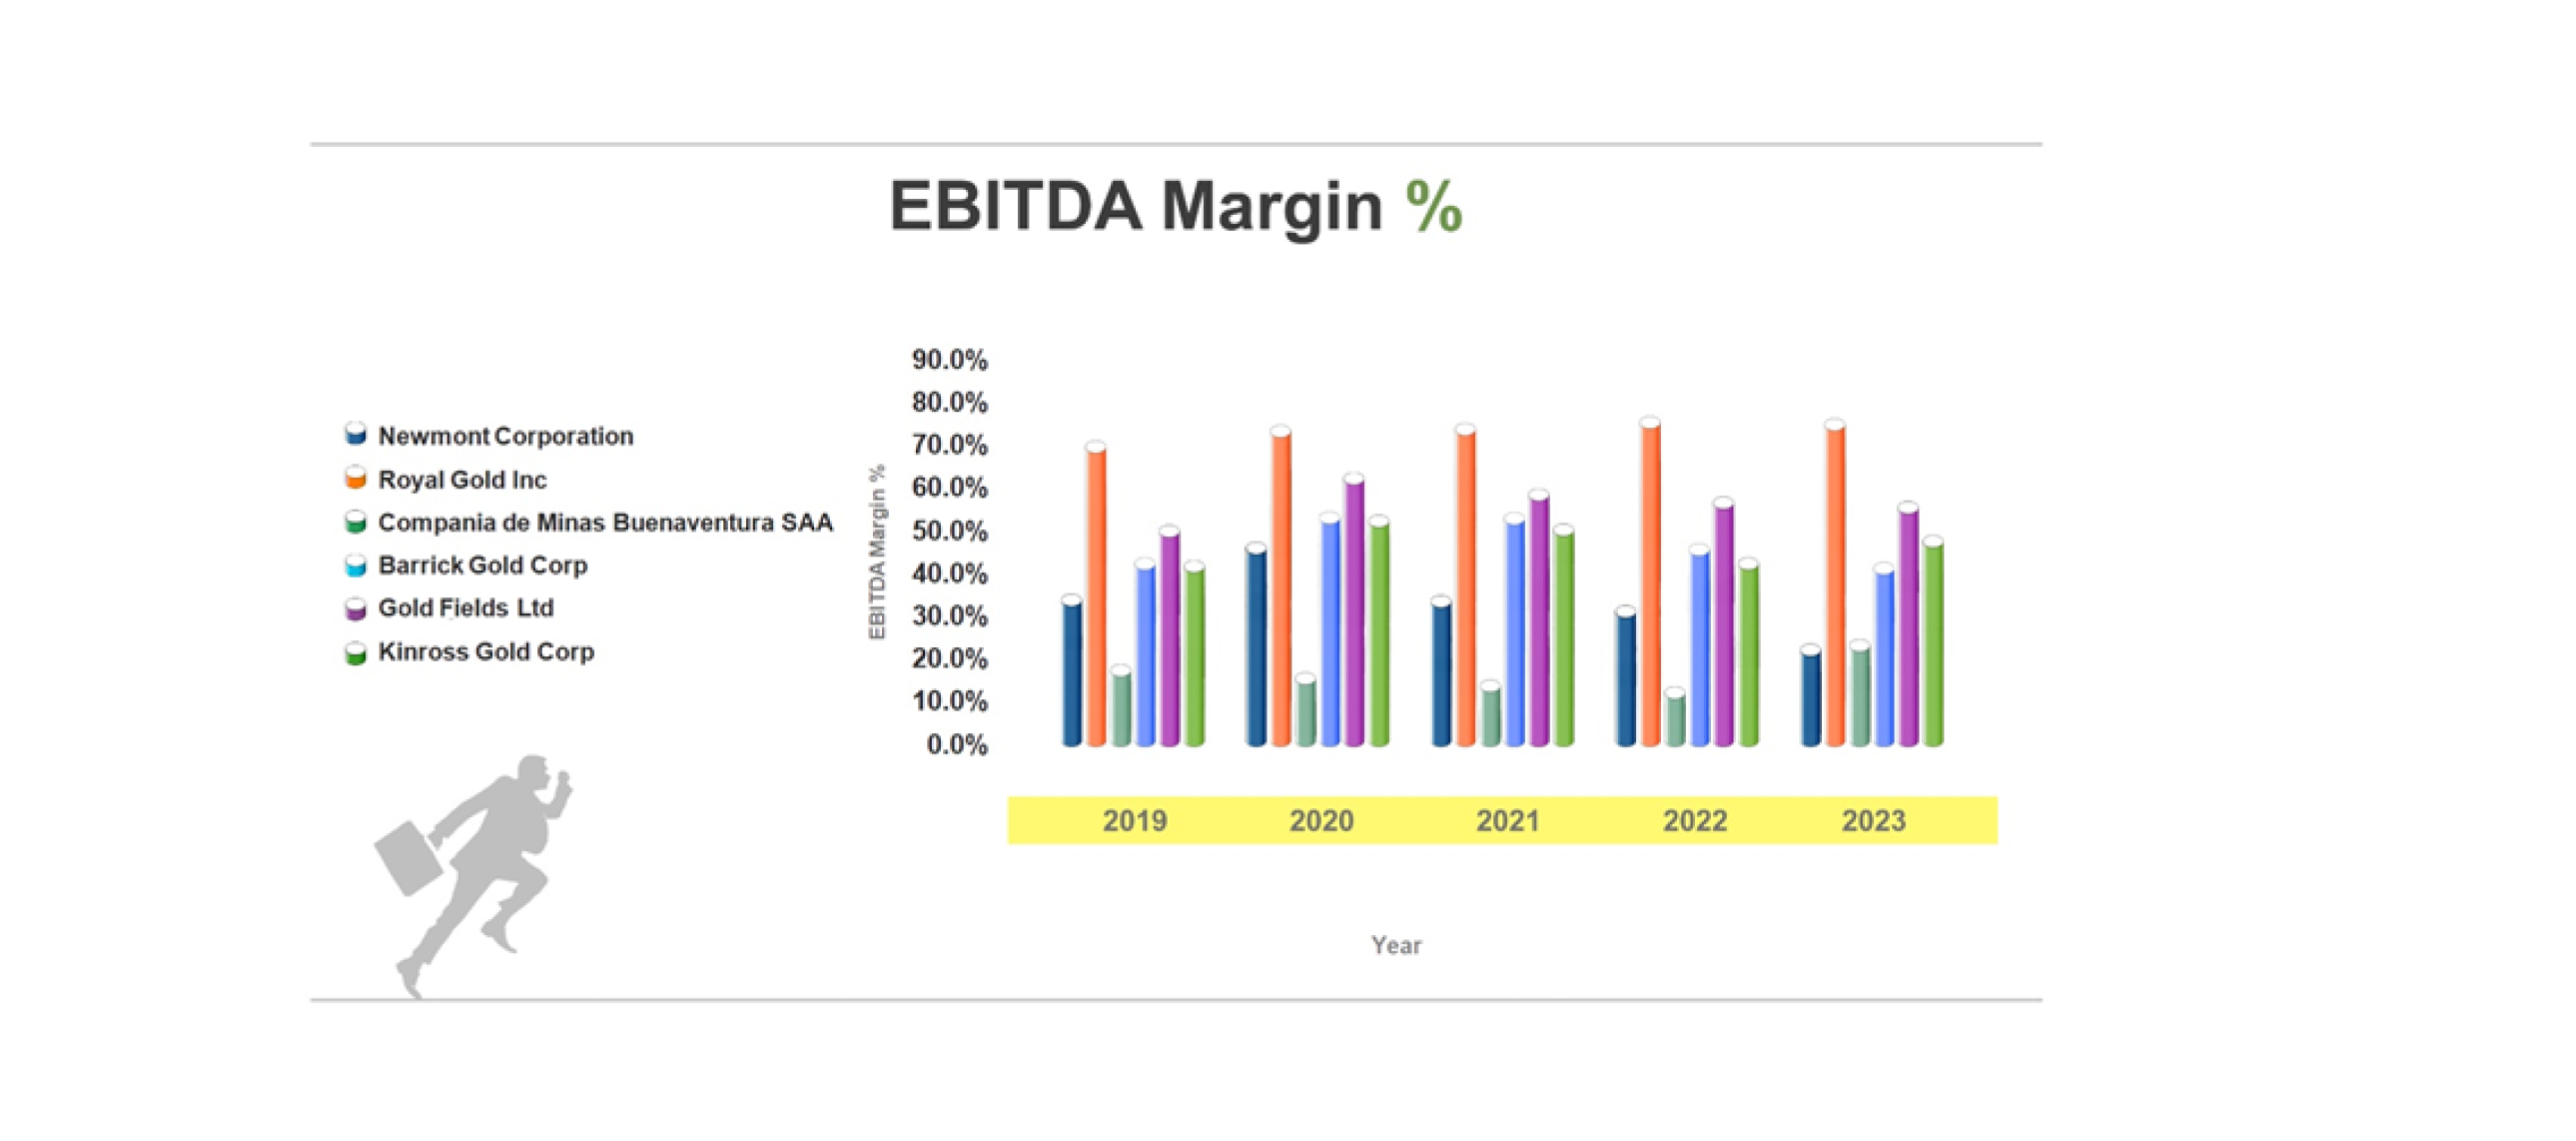
Operational Efficiency: The industry is accompanied by high extraction costs that tend to remain volatile against commodity pricing. EBITDA reflects the operating efficiency of the company.
Stock Insights: Royal Gold Inc demonstrated the greatest EBITDA margin relative to other peer companies with 77.3% in FY23. Compania de Minas Buenaventura SAA showed the highest positive change in the company’s operating margins, 25.4% in FY23 against 14.3% in FY22.
Data source: Refinitiv; Image Source: © 2024 Krish Capital Pty.Ltd; Analysis: Haanuwise
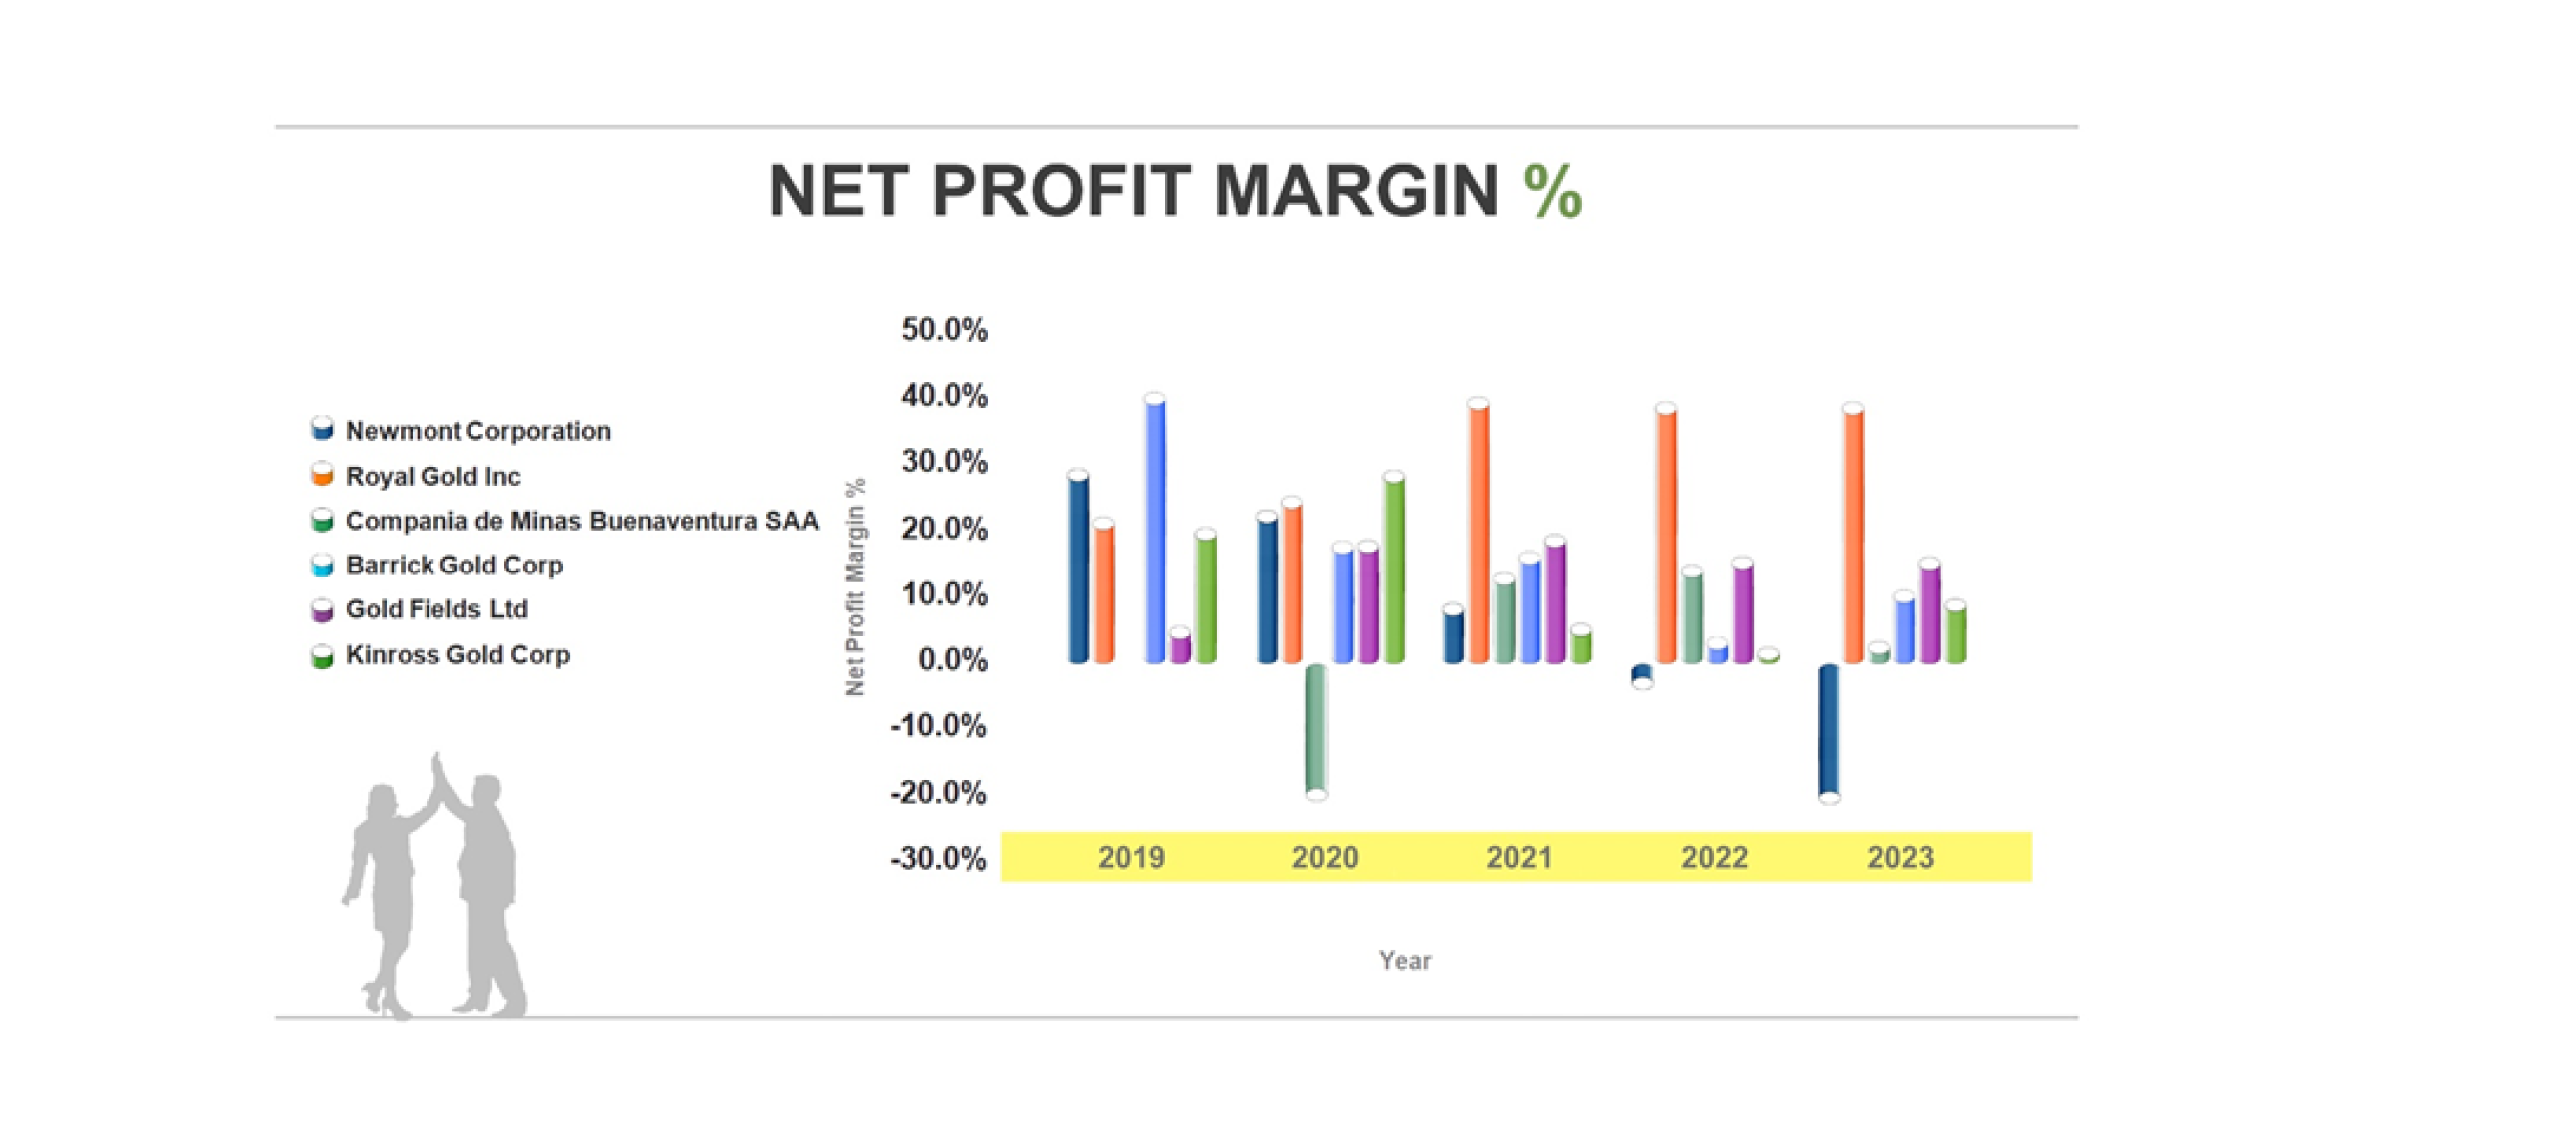
Growing Profitability: Net profit margins indicate bottom-line performance that is accounted for after adjusting all operating and non-operating expenses. This metric is a good indicator of industry’s positioning and its effective cost management strategies.
Stock Insights: Royal Gold Inc depicted the greater top line growth with 39.5% net margin in FY23 among the given peer companies of Precious Metals’ industry. All companies, except Newmont Corporation and Compania de Minas Buenaventura SAA displayed an upward trend in their respective bottom-line performance.
 MATERIALS
Data source: MSCI; Image Source: © 2024 Krish Capital Pty.Ltd
Key Trends:
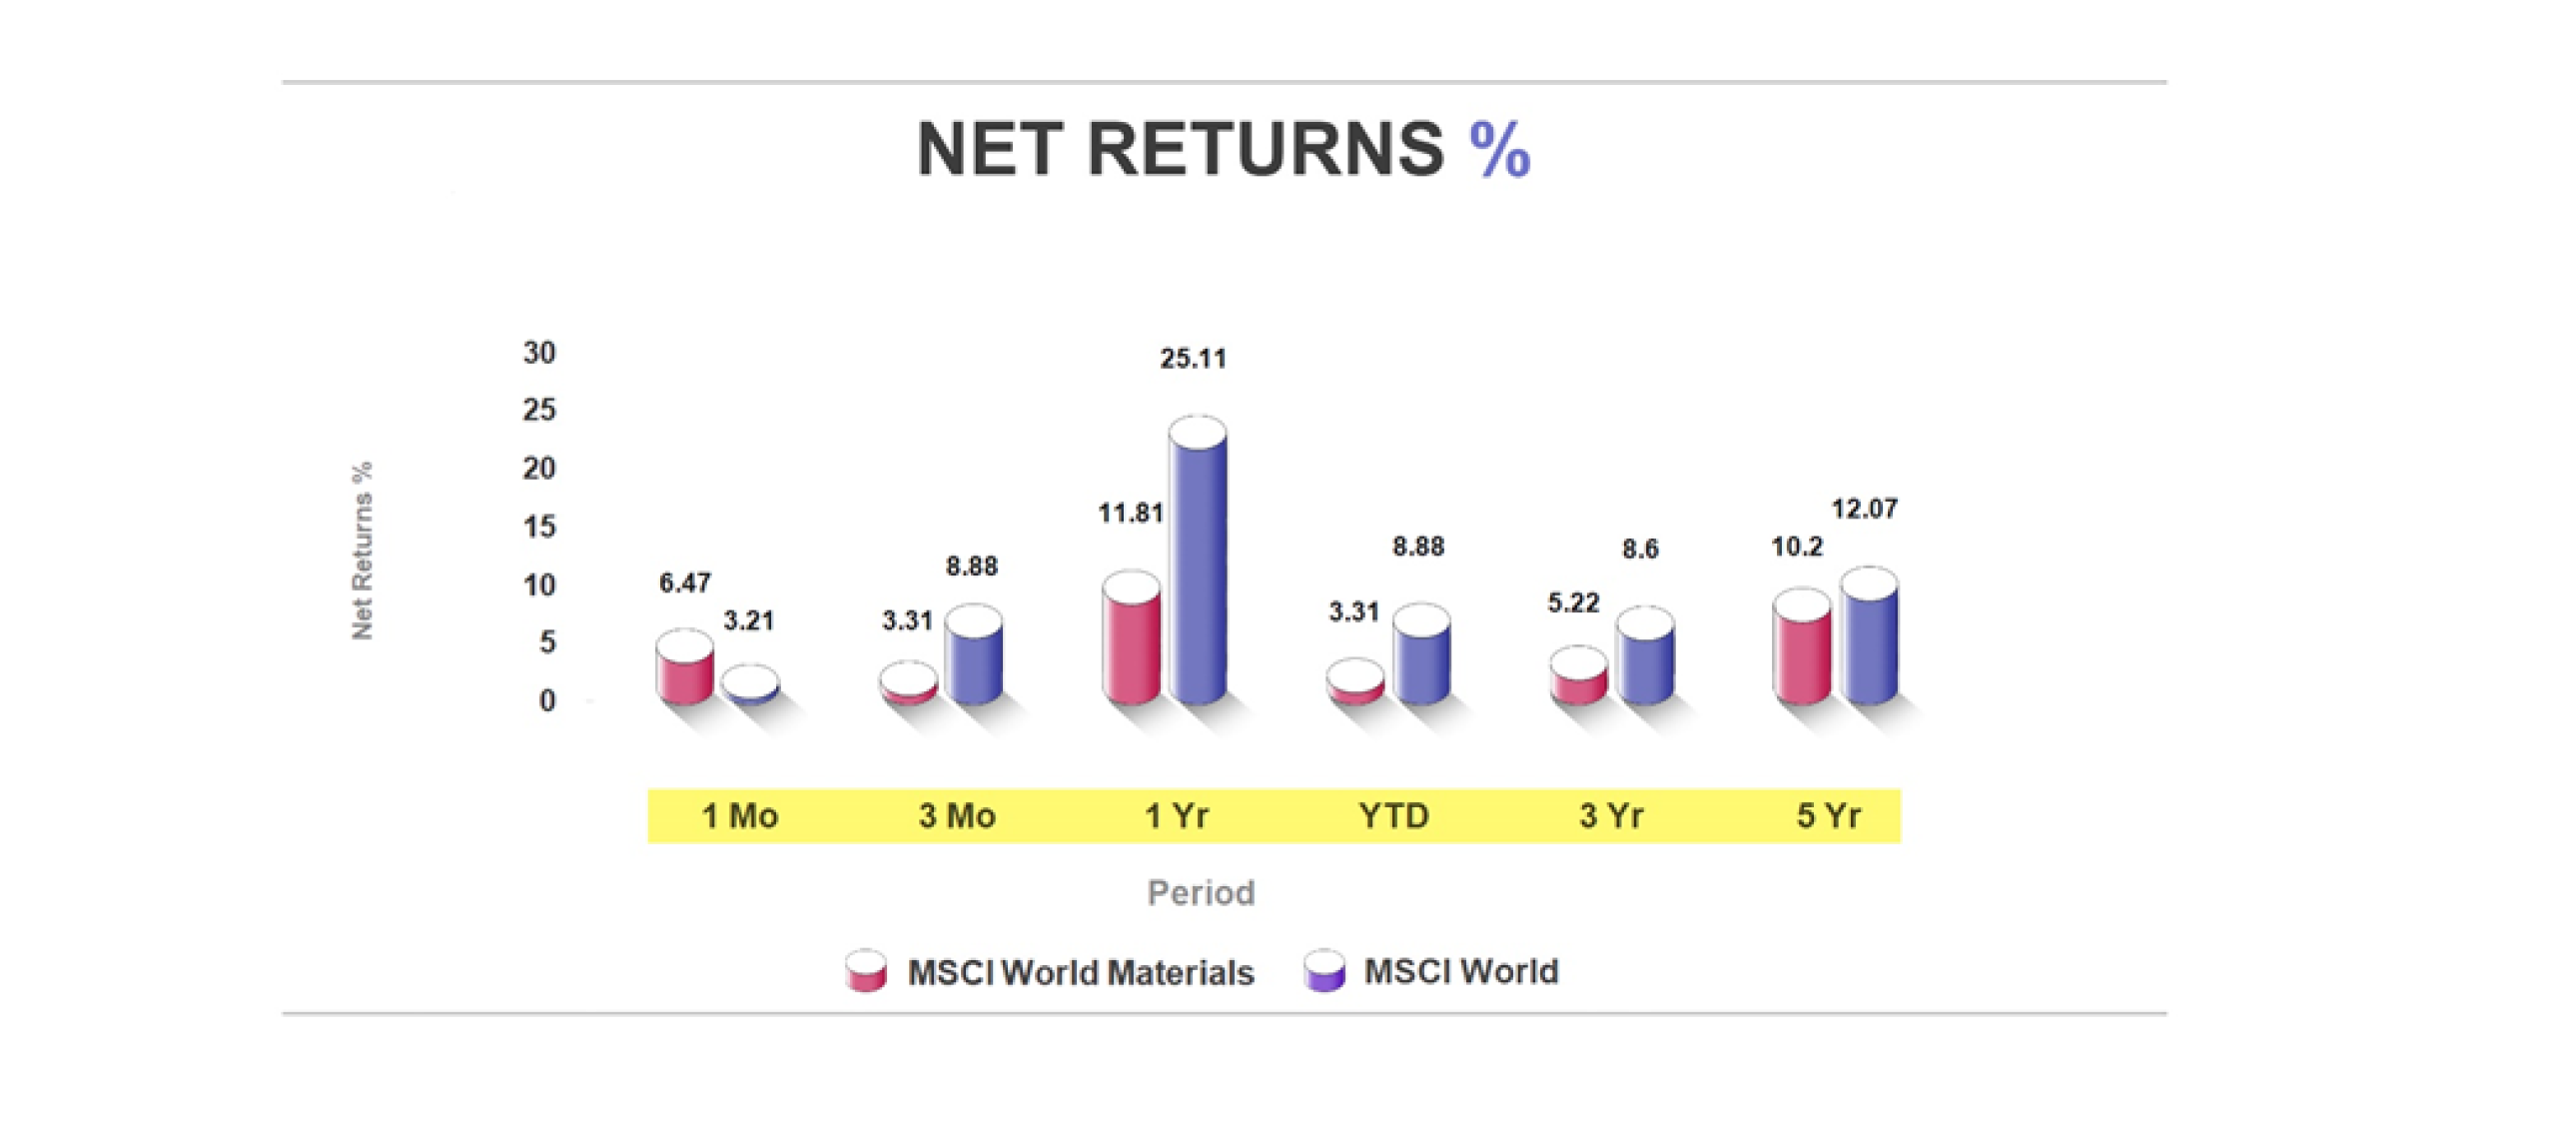
Historical Performance: The materials sector significantly underperformed over the long term as indicated by the 3-year and 5-years’ benchmark. The underperformance was due to tightening consumer consumption amid interest rate hikes during 2023.
Recent Performance: The recent performance of the materials industry is looking strong (1-month outperformance) incidentally to the Fed’s announcement of rate cut in March 2024. The outlook of the materials industry remains robust due to the upturn in the economic cycle as soon as the Fed rates start to slash.
source: Refinitiv; Image Source: © 2024 Krish Capital Pty.Ltd; Analysis: Haanuwise
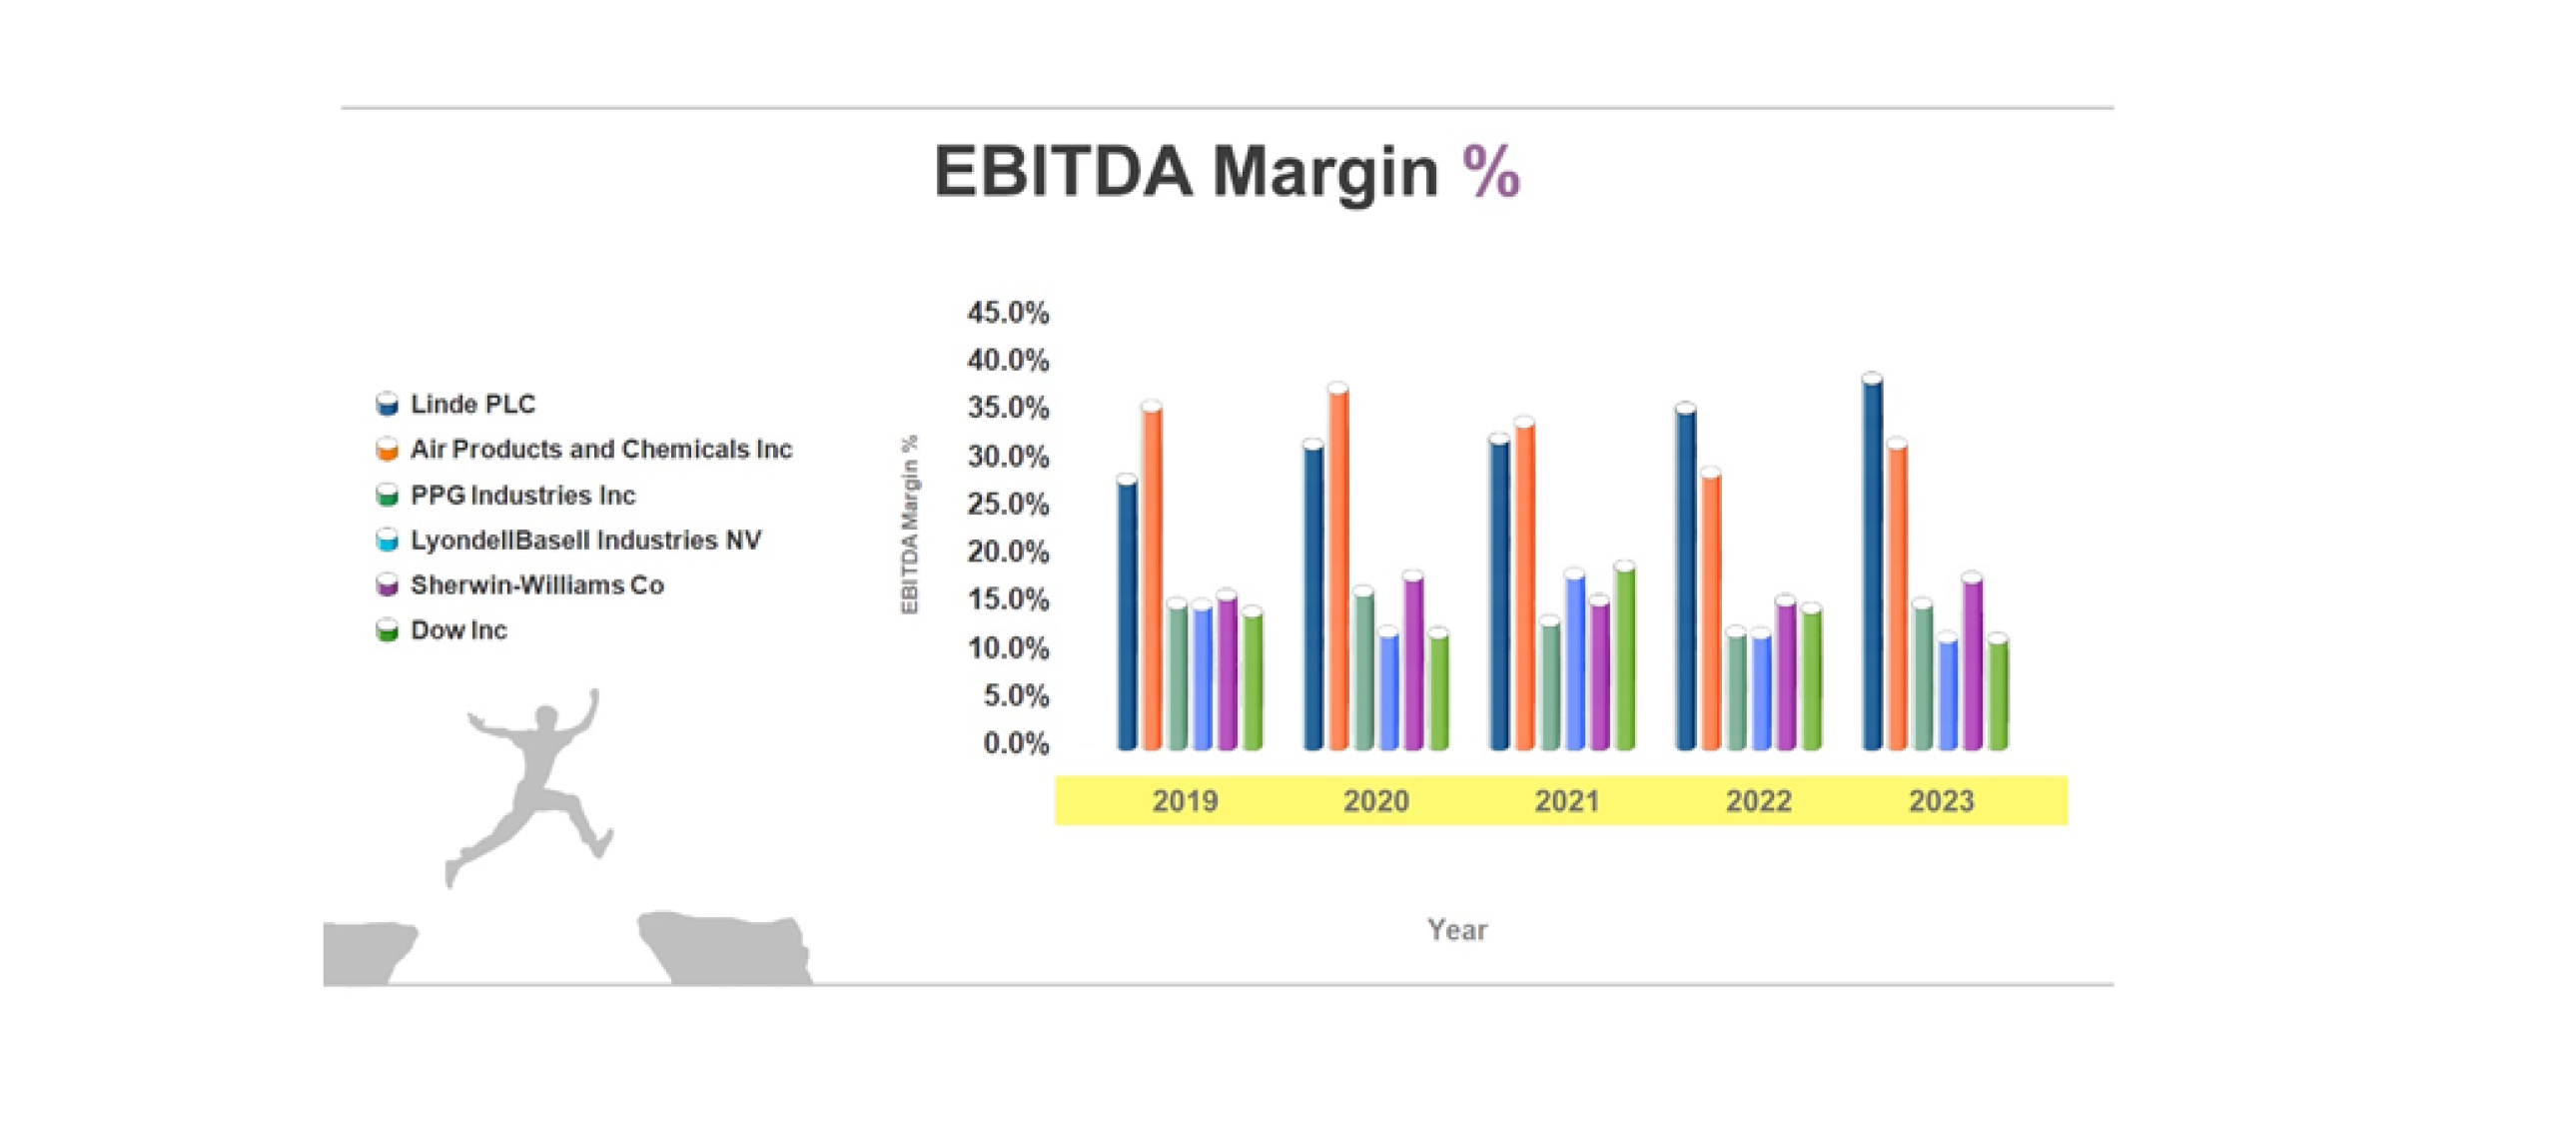
Cyclical Sector: Materials industry is a cyclical sector and is therefore sensitive to commodity pricing, economic shocks, and global demand. EBITDA margin reflects the operational efficiency of the company after eliminating the effects of non-operating factors like taxes and interest rates that tend to alter the economic cycle. Thus, EBITDA margin provides a clearer picture of company’s operating performance.
Stock Insights: Linde PLC accounted for the higher EBITDA margin among its peers, with an EBITDA margin of 39.3% in FY23, followed by Air Products and Chemicals Inc with an EBITDA margin of 32.5% in FY23.
Data source: Refinitiv; Image Source: © 2024 Krish Capital Pty.Ltd; Analysis: Haanuwise
Growing Free Cash Flow Yield: Materials industry is equipped with immense growth opportunities which composes of setting acquisition targets, R&D investments, and expansion projects. Free cash flow yield implies the company’s ability to pursue their strategic expansion opportunities by indicating insights into their financial health relative to their asset base.
Stock Insights: LyondellBasell Industries NV exhibited highest Free cash flow relative to its market capitalization among its other competitor companies in the United States.
 FINANCIALS
Key Trends:
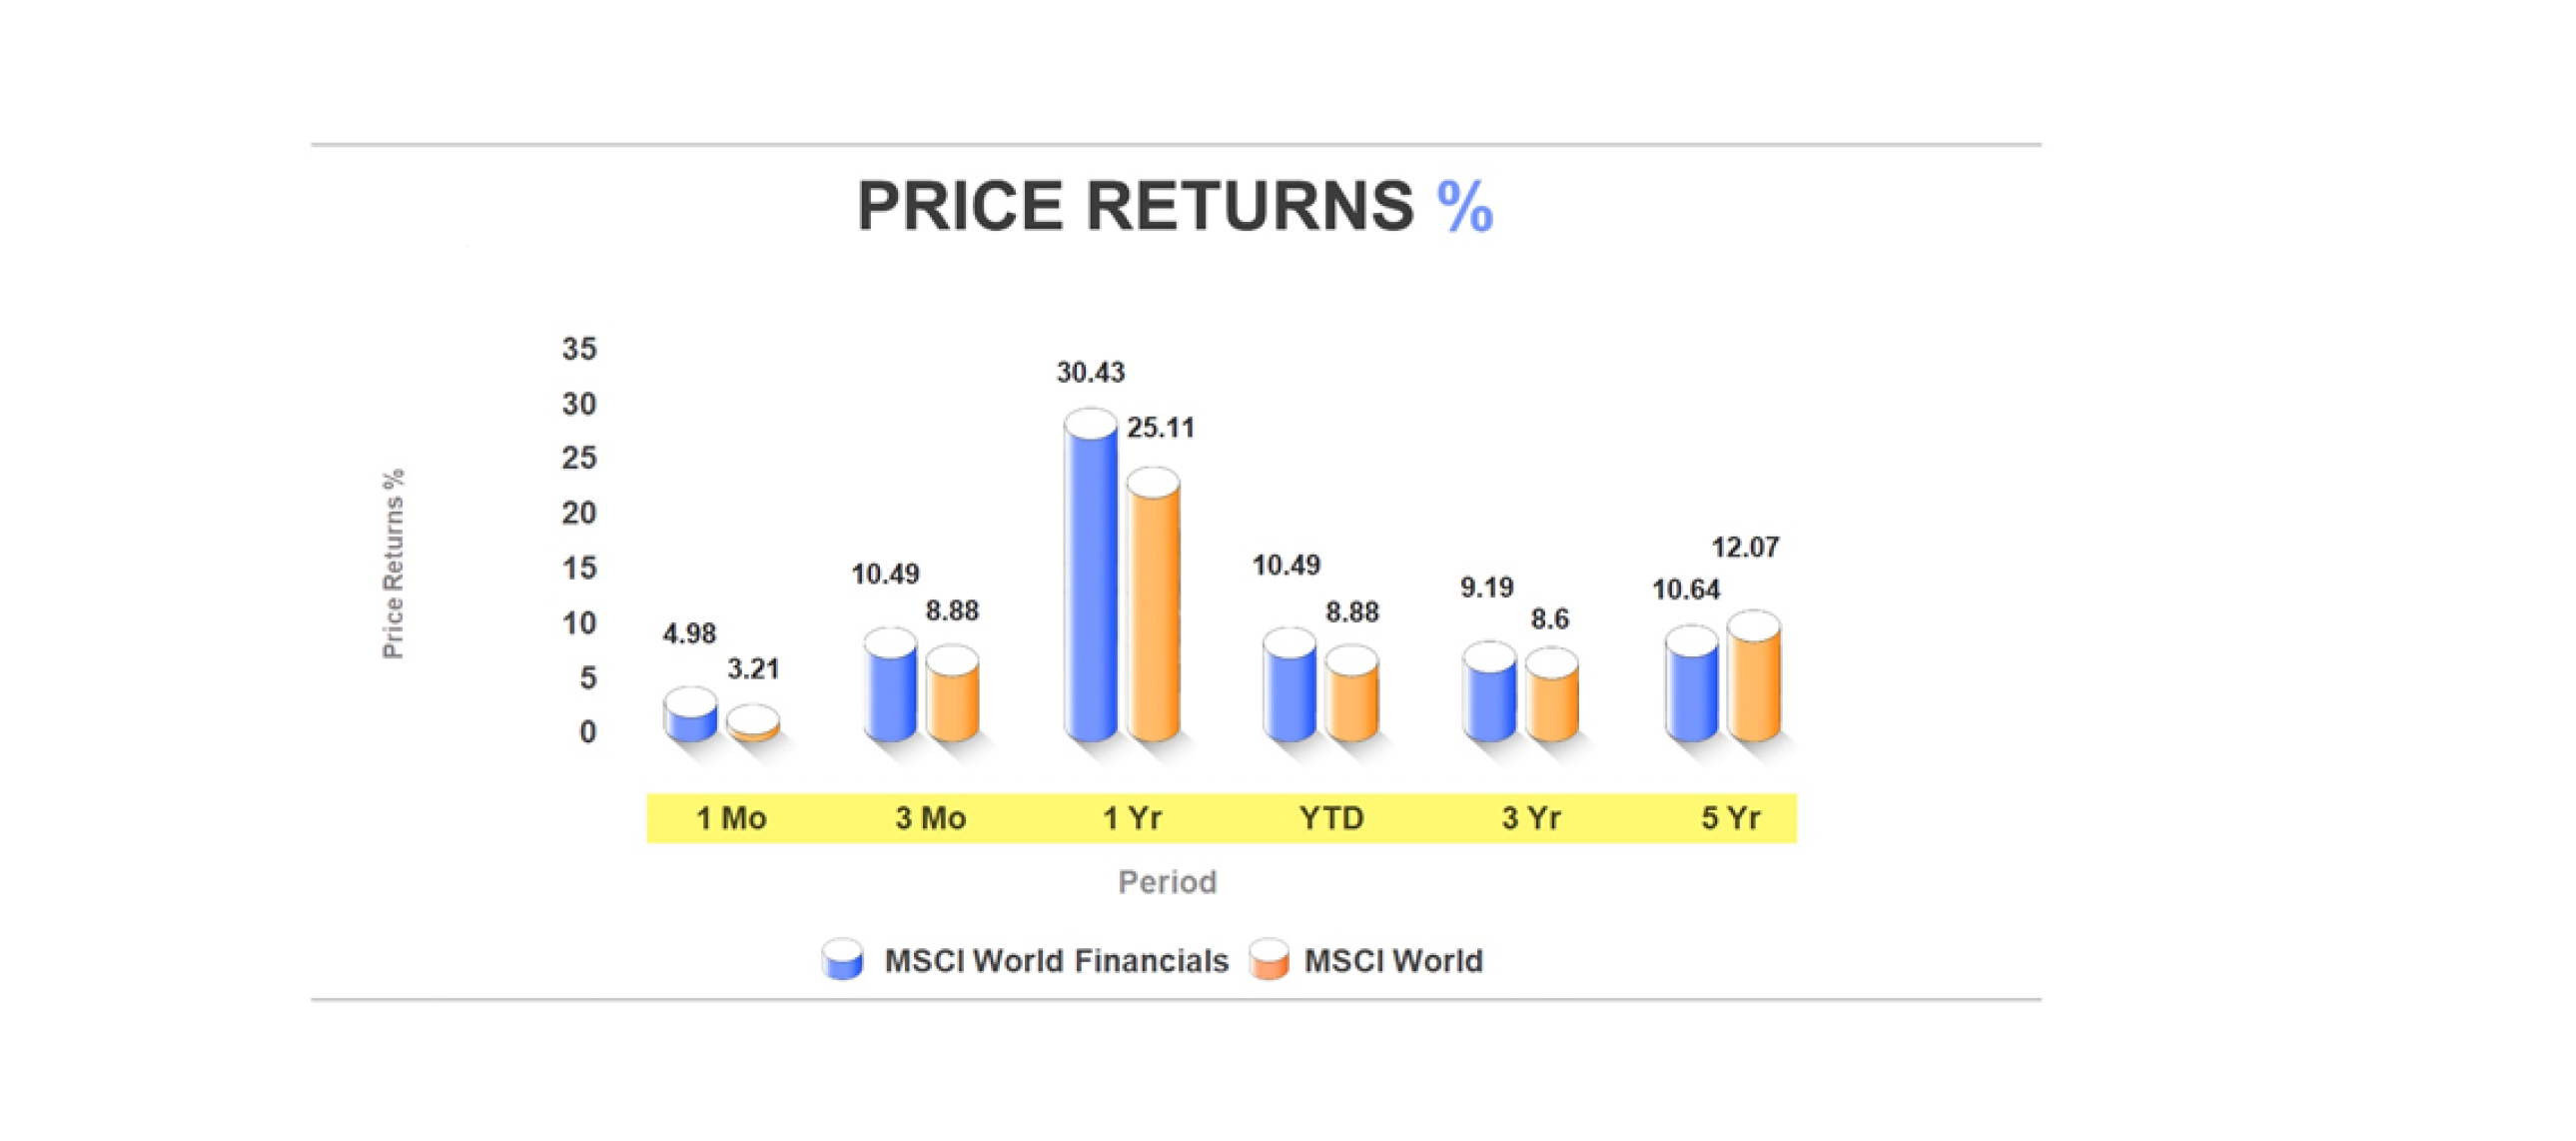
Recent Performance: Over the period, the global financial sector outperformed its benchmark with significant improvement in its 1-year performance. Although banks’ performance got hindered in 2023 due to the collapse of Silicon Valley Bank (SVB), reviving the memories of the 2008 crisis. Weaker loan growth and inflating NPAs also contributed to the unsatisfactory performance of major banks over a long-run period.
Outlook: The Fed rate cut policy intends to push consumer demand forward with a likable increase in the bank’s loan portfolio.
Data source: Refinitiv; Image Source: © 2024 Krish Capital Pty.Ltd; Analysis: Haanuwise
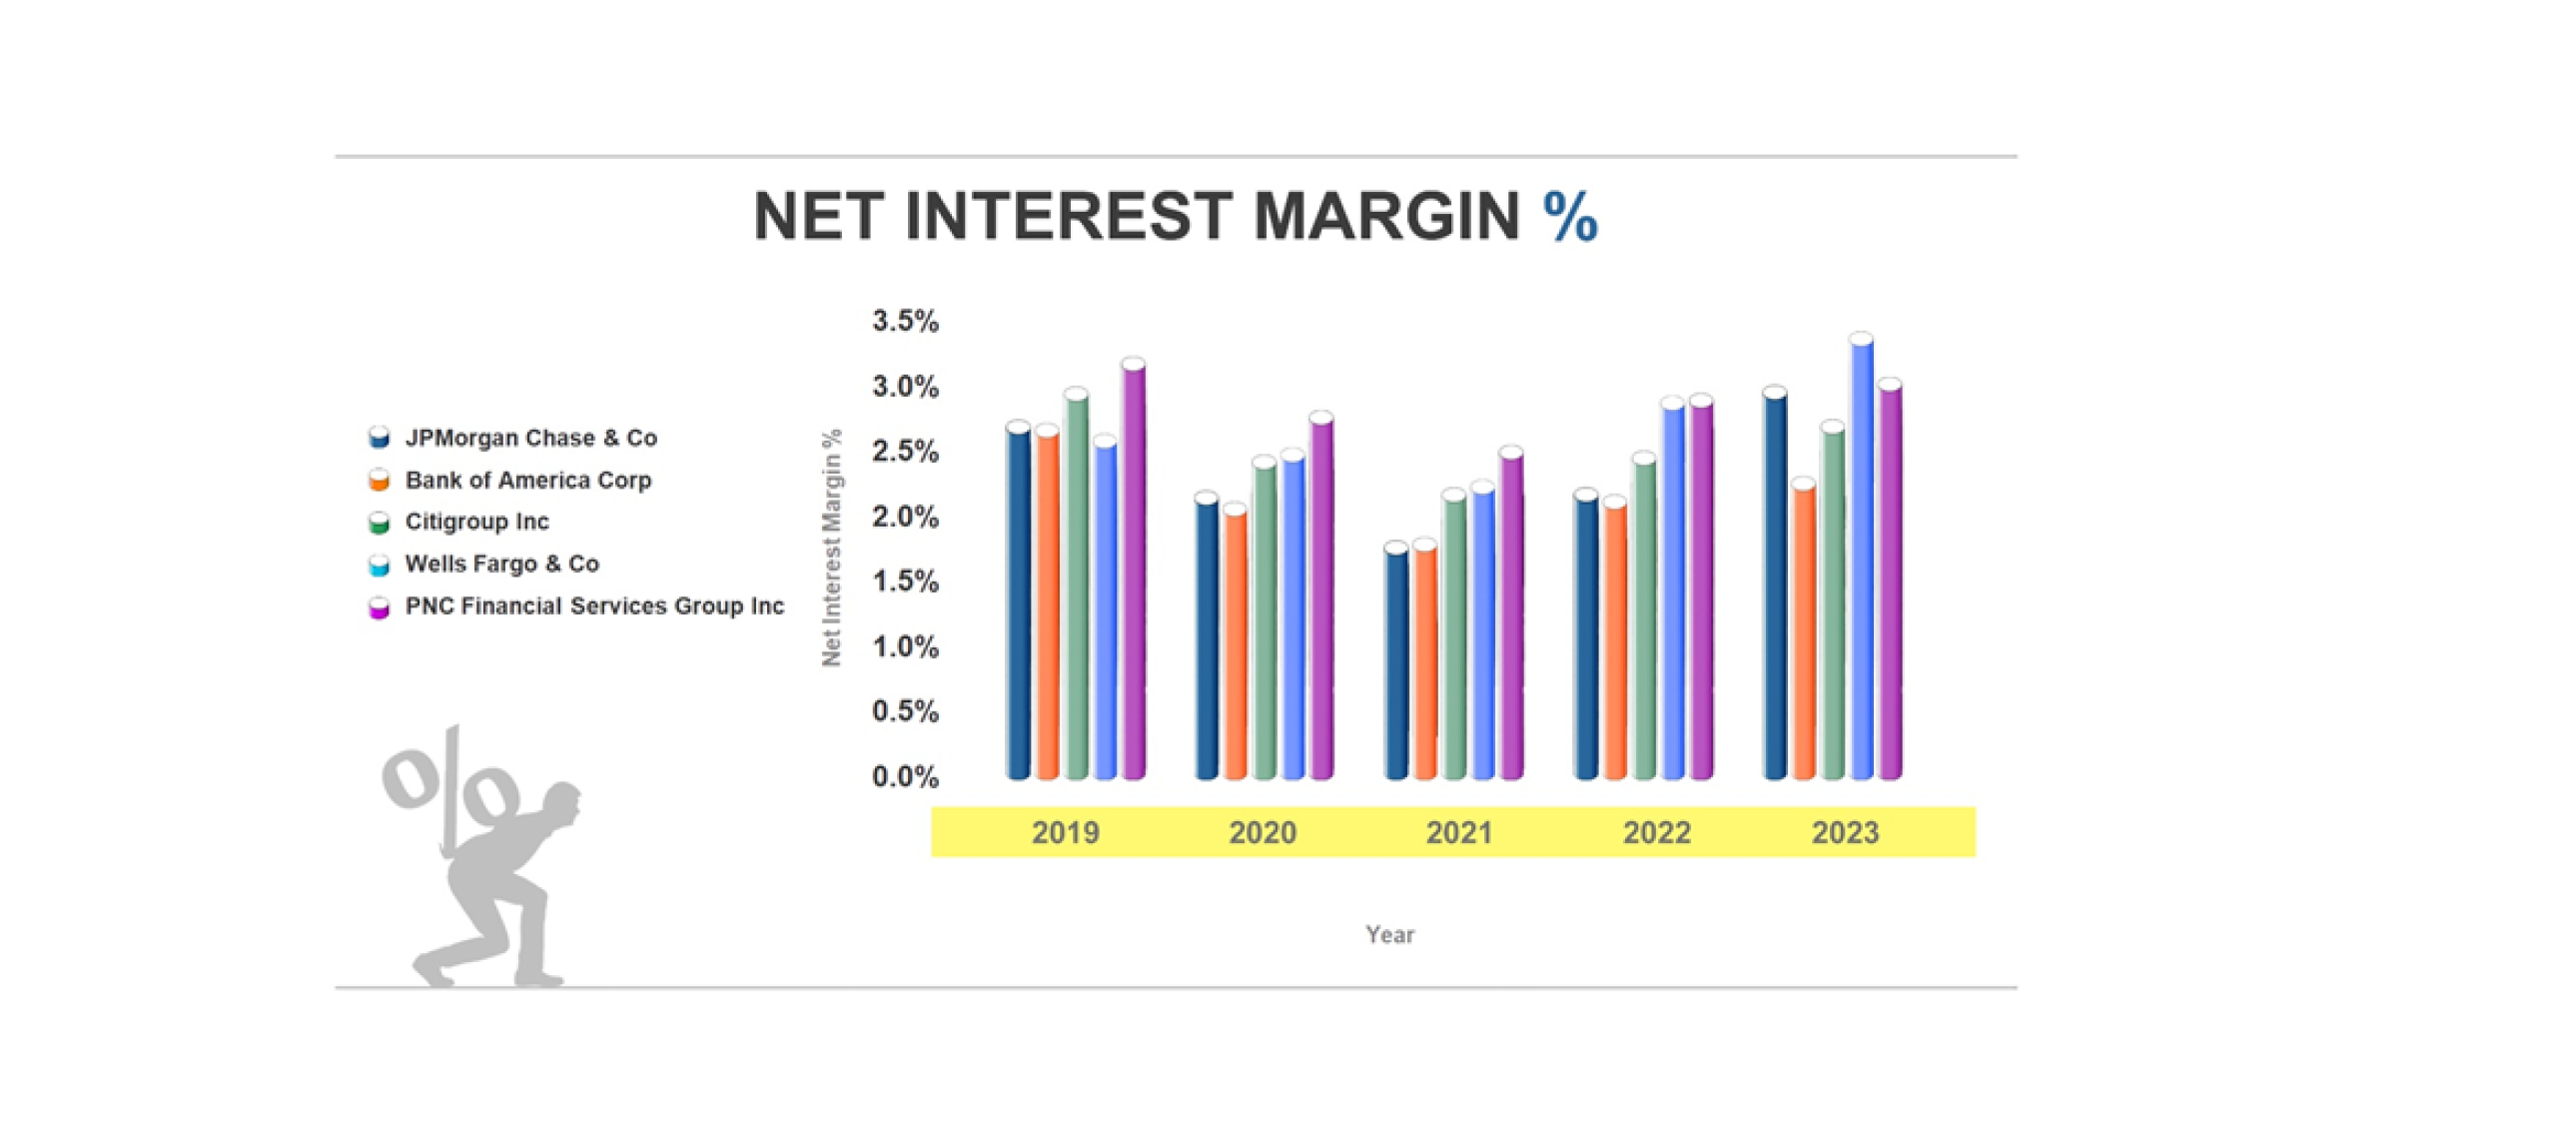
Net interest margin: This metric demonstrates the difference between interest income and interest expense for the bank, implying the bank’s operating efficiency, profitability, and effective competitiveness within the overall industry. Typically, net interest margin highlights the top line performance of the financial sector.
Stock Insights: Net Interest margin for Wells Fargo & Co is rising sharply amid peers, figuring 3.1% in FY23.
Data source: Refinitiv; Image Source: © 2024 Krish Capital Pty.Ltd; Analysis: Haanuwise
 ARTIFICIAL INTELLIGENCE & EMERGING TECHNOLOGIES
Data source: MSCI; Image Source: © 2024 Krish Capital Pty.Ltd
Key Trends:
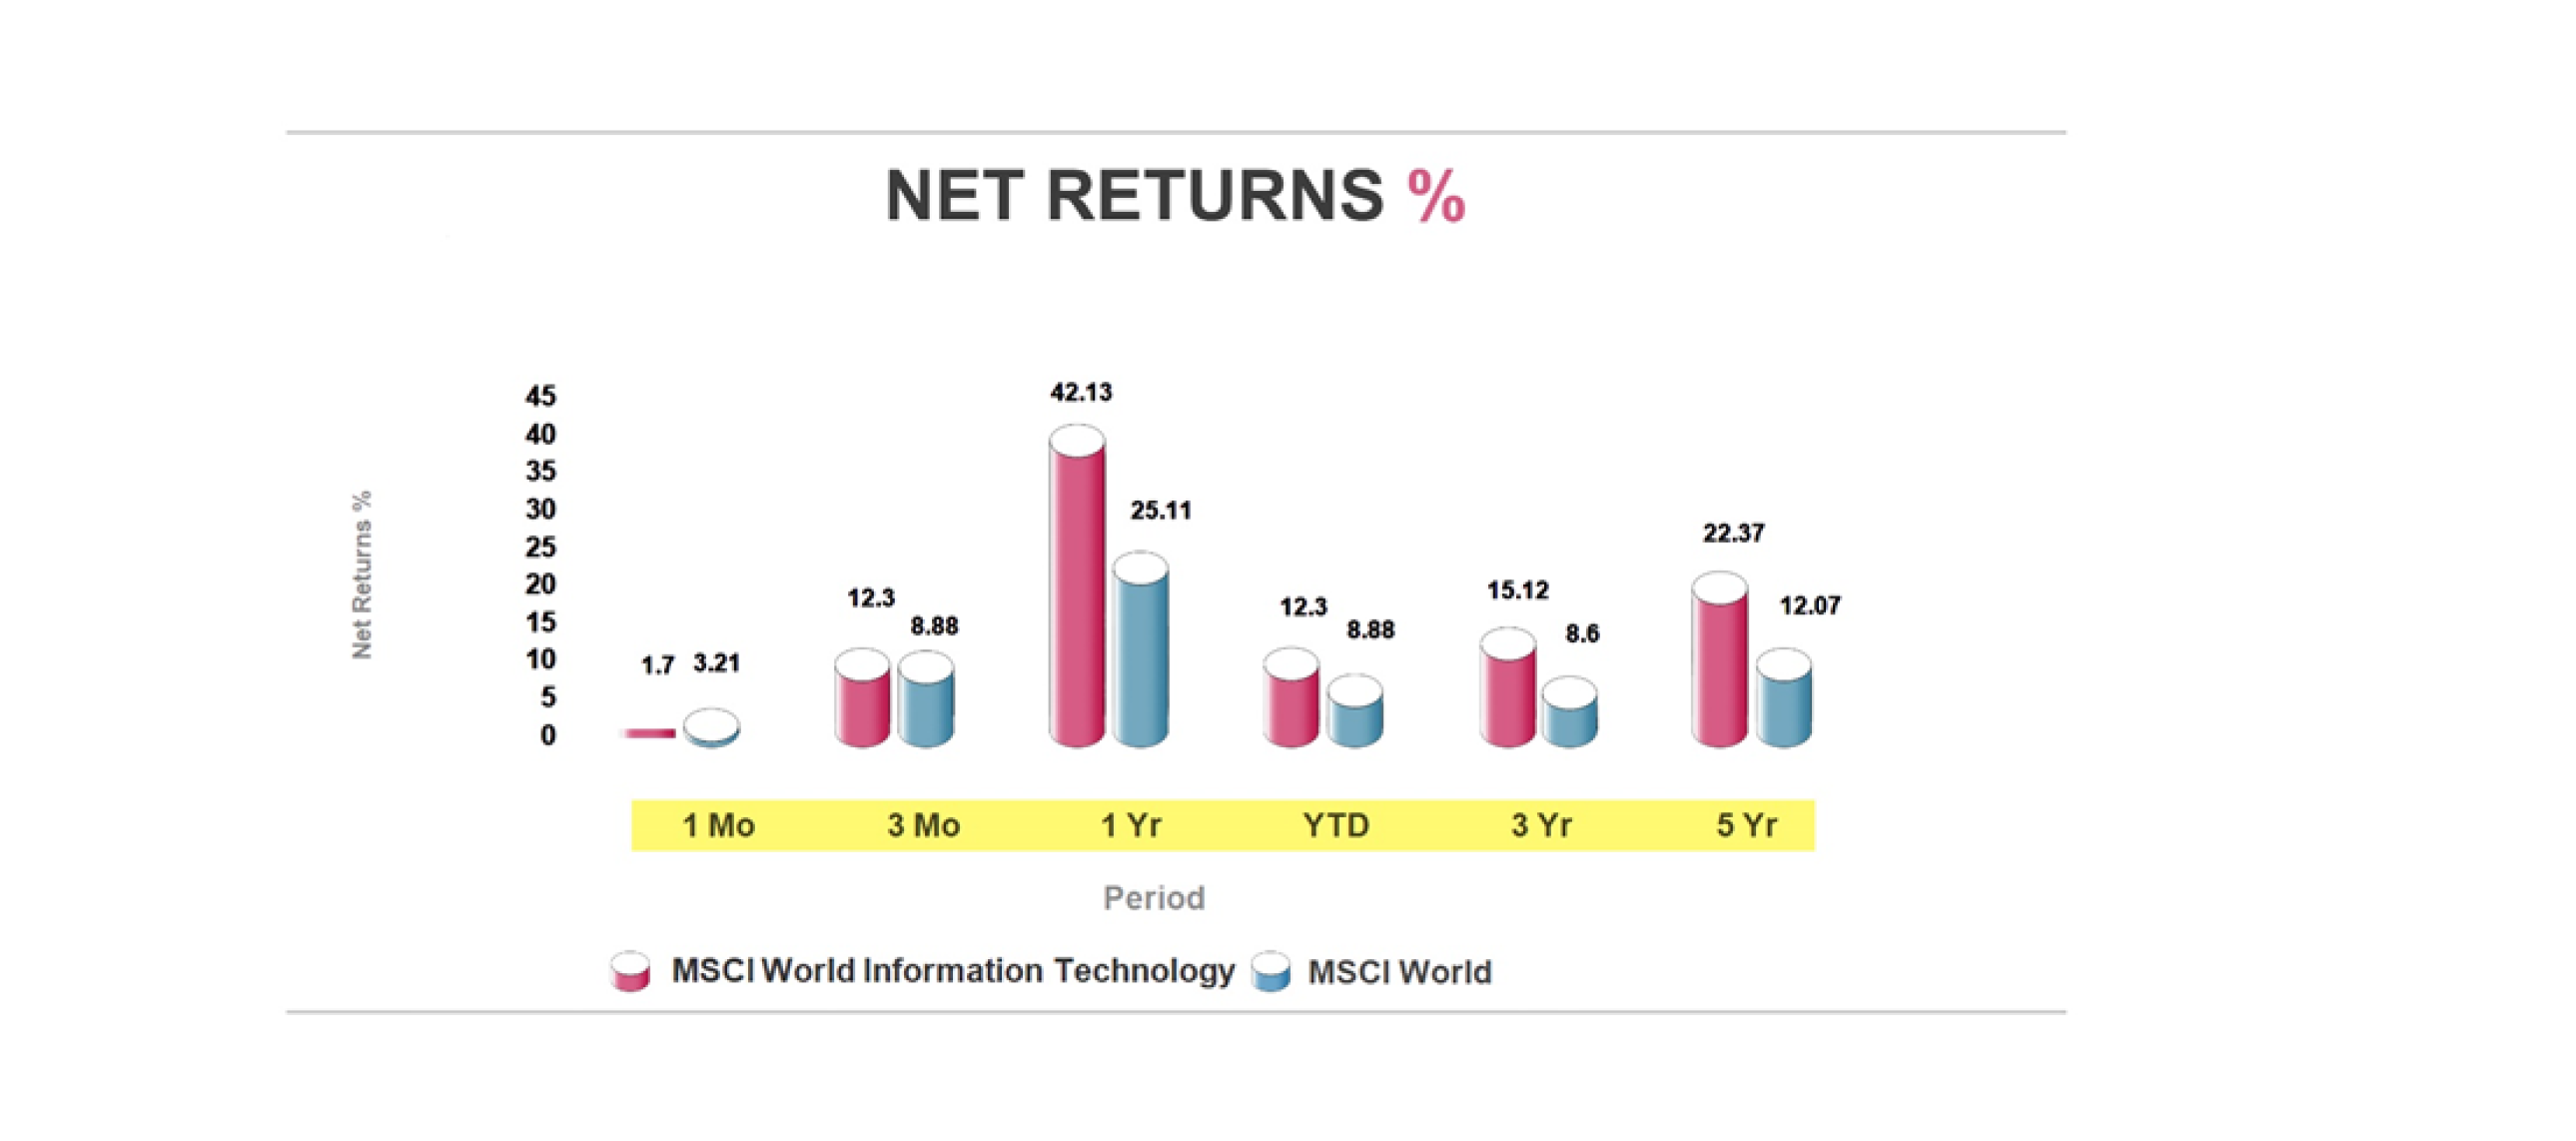
Historical Performance: Over the historical and recent period, the Artificial Intelligence & Emerging Technologies sector has globally outperformed the MSCI World Index. In 2023, the Artificial Intelligence & Emerging Technologies sector was the top performer with the launch of ChatGPT, strengthening the outcome for several AI-oriented firms.
Growth in Artificial Intelligence: The outperformance was driven by substantial transformation in Artificial Intelligence (AI). Owing to the transition, the opportunities are escalating gradually for semiconductor companies creating systems and chips used in AI applications.
Stock Insights: Microsoft Corp is heavily re-investing their profits in potential growth opportunities with capex growth of 54.8% in FY23 vs 14.5% in FY22.
Data source: Refinitiv; Image Source: © 2024 Krish Capital Pty.Ltd; Analysis: Haanuwise
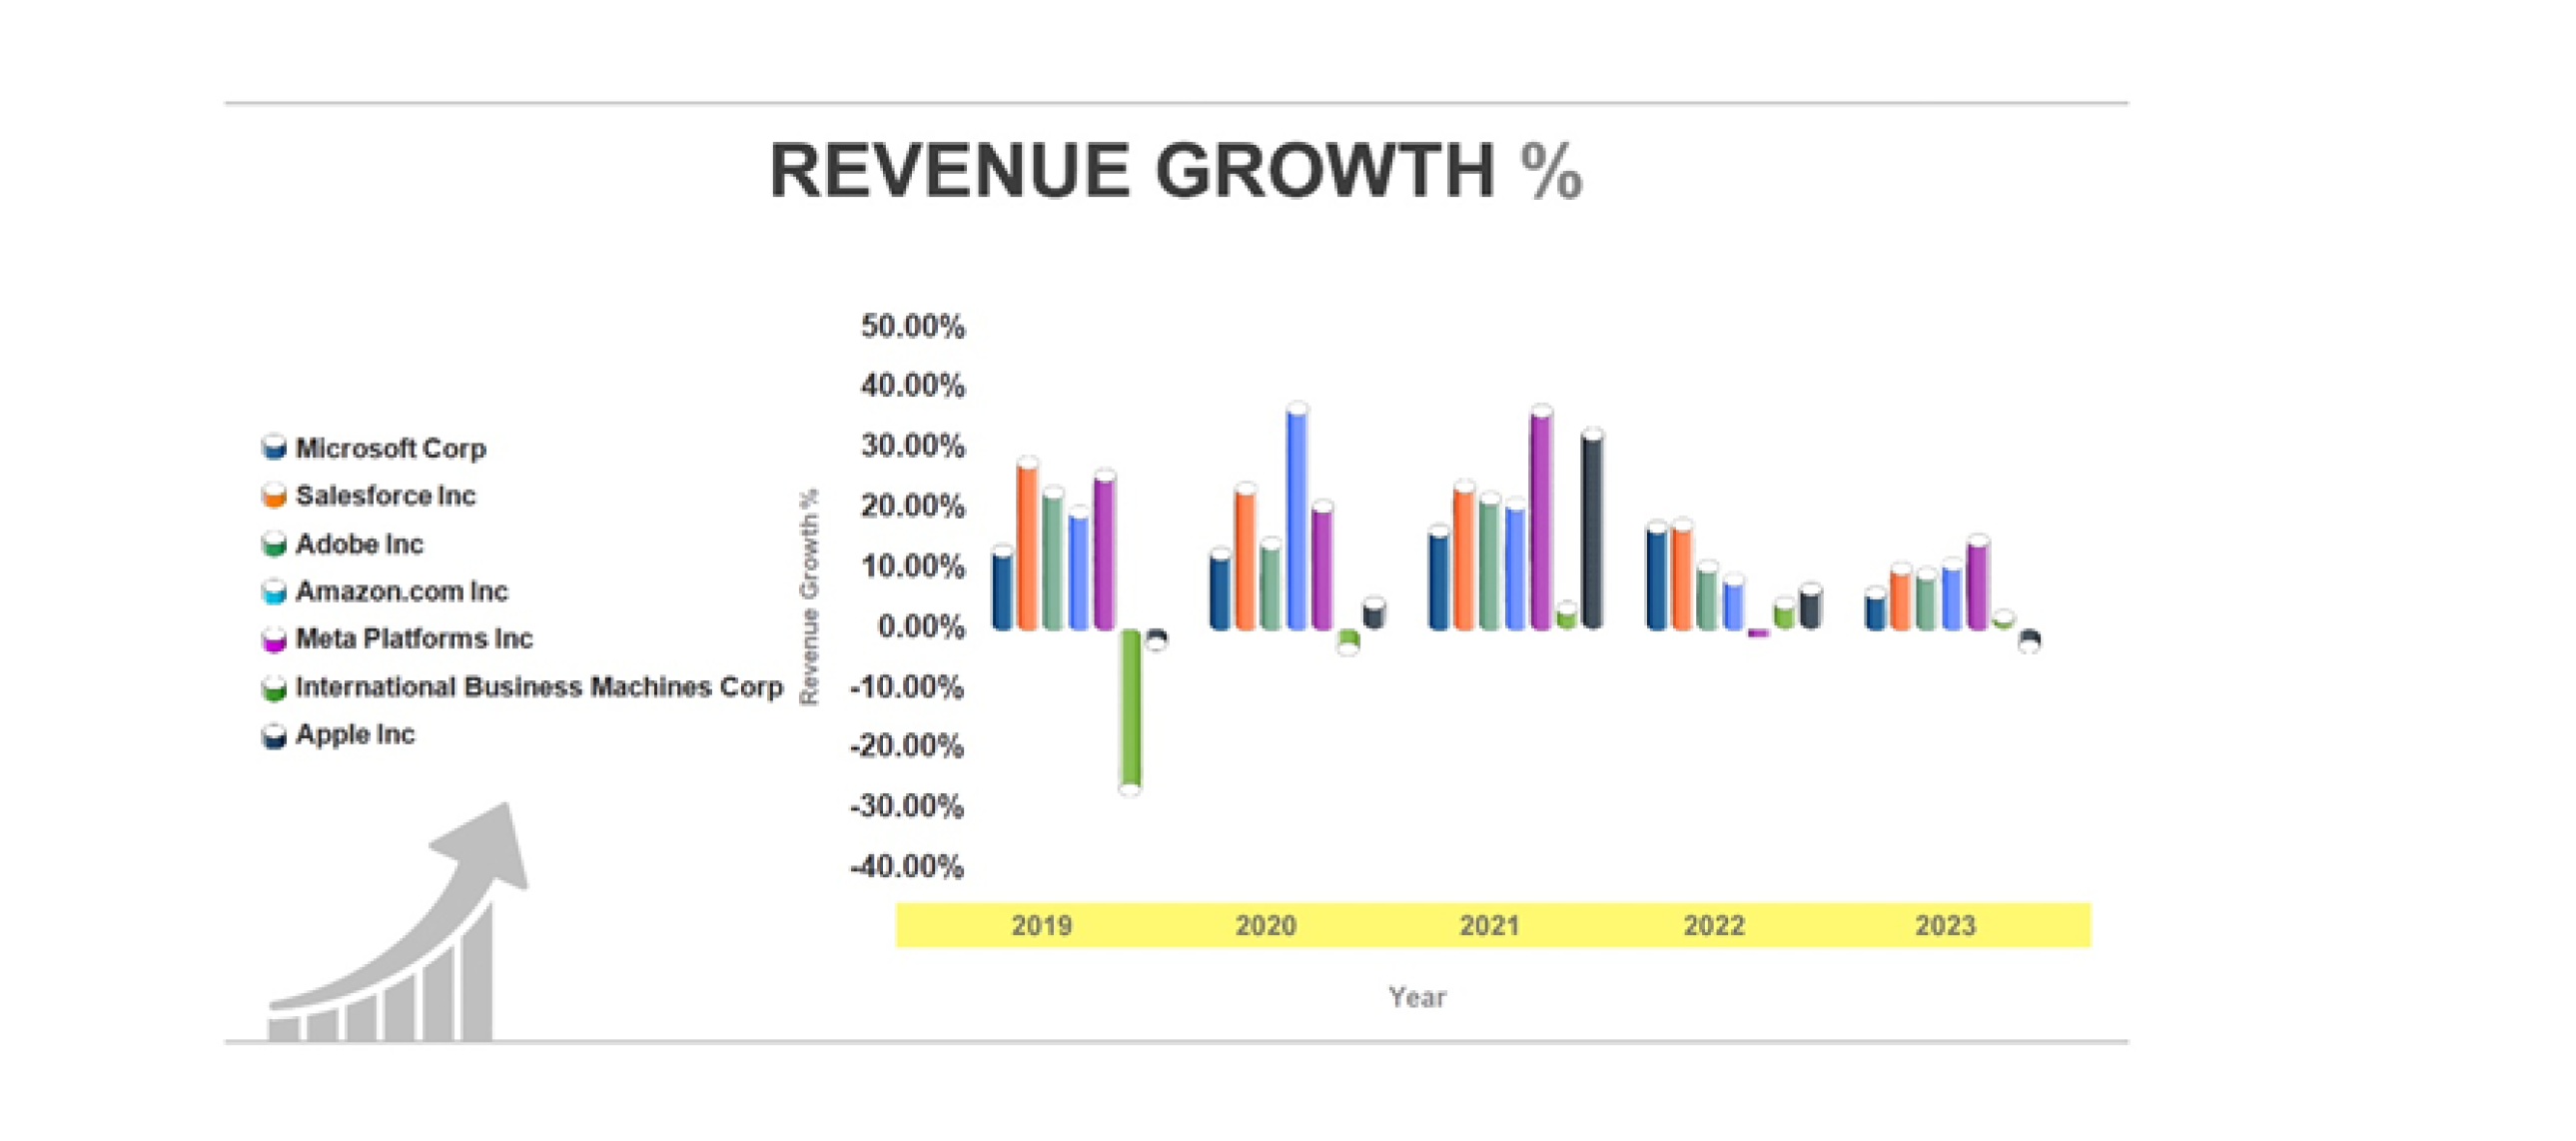
Growth in Top-line: Technology sector is equipped with extensive technological advancement and innovation; thus, revenue growth is a good indicator of industry’s competitiveness and product demand.
Stock Insights: The revenue for NVIDIA skyrocketed in FY23 with their extensive investments in AI related programs. The top line of Meta Platforms Inc also surged steeply in FY23 with 15.59% of revenue growth as compared to -1.12% revenue growth in FY22.
To summarize, in 2024, the opportunities for sustainable growth include AI adoption in tech and communication services sectors, decarbonization in utilities and energy sectors, efficient operations in precious metals and material sectors, and financial firms leveraging technology for growth and efficiency. These sectors offer resilience amidst market fluctuations and align with evolving global trends.
Disclaimer – The information available on this website is provided for education and informational purposes only. It does not constitute or provide financial, investment or trading advice and should not be construed as an endorsement of any specific stock or financial strategy in any form or manner. We do not make any representations or warranties regarding the quality, reliability, or accuracy of the information provided. This website may contain links to third-party content. We are not responsible for the content or accuracy of these external sources and do not endorse or verify the information provided by third parties. We are not liable for any decisions made or actions taken based on the information provided on this website.